Fig. 2
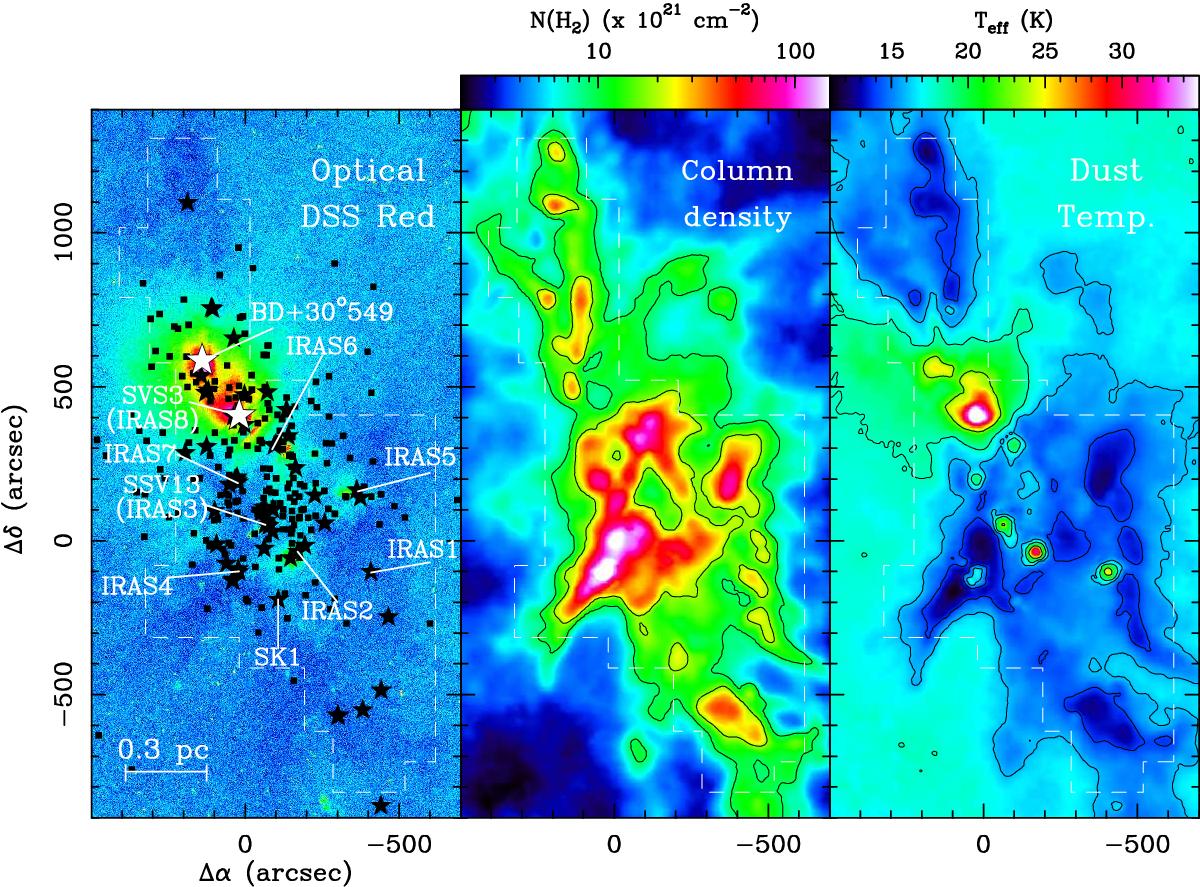
Optical DSS Red image (left) of the NGC 1333 clump compared to the Herschel-Planck total column density (centre) and dust effective temperature (right) maps (Zari et al. 2016). Offsets are referred to the map centre with coordinates ![]() in radio projection. The position of the two B-type stars (solid white stars), as well as all the Class 0/I protostars (solid black stars) and Class Flat/II/III objects (solid black squares) identified by Rebull (2015), are indicated in the first subpanel. The black contours correspond to extinction values of AV = 10 and 20mag and dust effective temperatures of Teff = 14, 16, and 18 K in their respective maps. For comparison, the area covered by our IRAM 30 m observations is indicated by a dashed line in all plots (see also Fig. 5).
in radio projection. The position of the two B-type stars (solid white stars), as well as all the Class 0/I protostars (solid black stars) and Class Flat/II/III objects (solid black squares) identified by Rebull (2015), are indicated in the first subpanel. The black contours correspond to extinction values of AV = 10 and 20mag and dust effective temperatures of Teff = 14, 16, and 18 K in their respective maps. For comparison, the area covered by our IRAM 30 m observations is indicated by a dashed line in all plots (see also Fig. 5).
Current usage metrics show cumulative count of Article Views (full-text article views including HTML views, PDF and ePub downloads, according to the available data) and Abstracts Views on Vision4Press platform.
Data correspond to usage on the plateform after 2015. The current usage metrics is available 48-96 hours after online publication and is updated daily on week days.
Initial download of the metrics may take a while.