Fig. 17
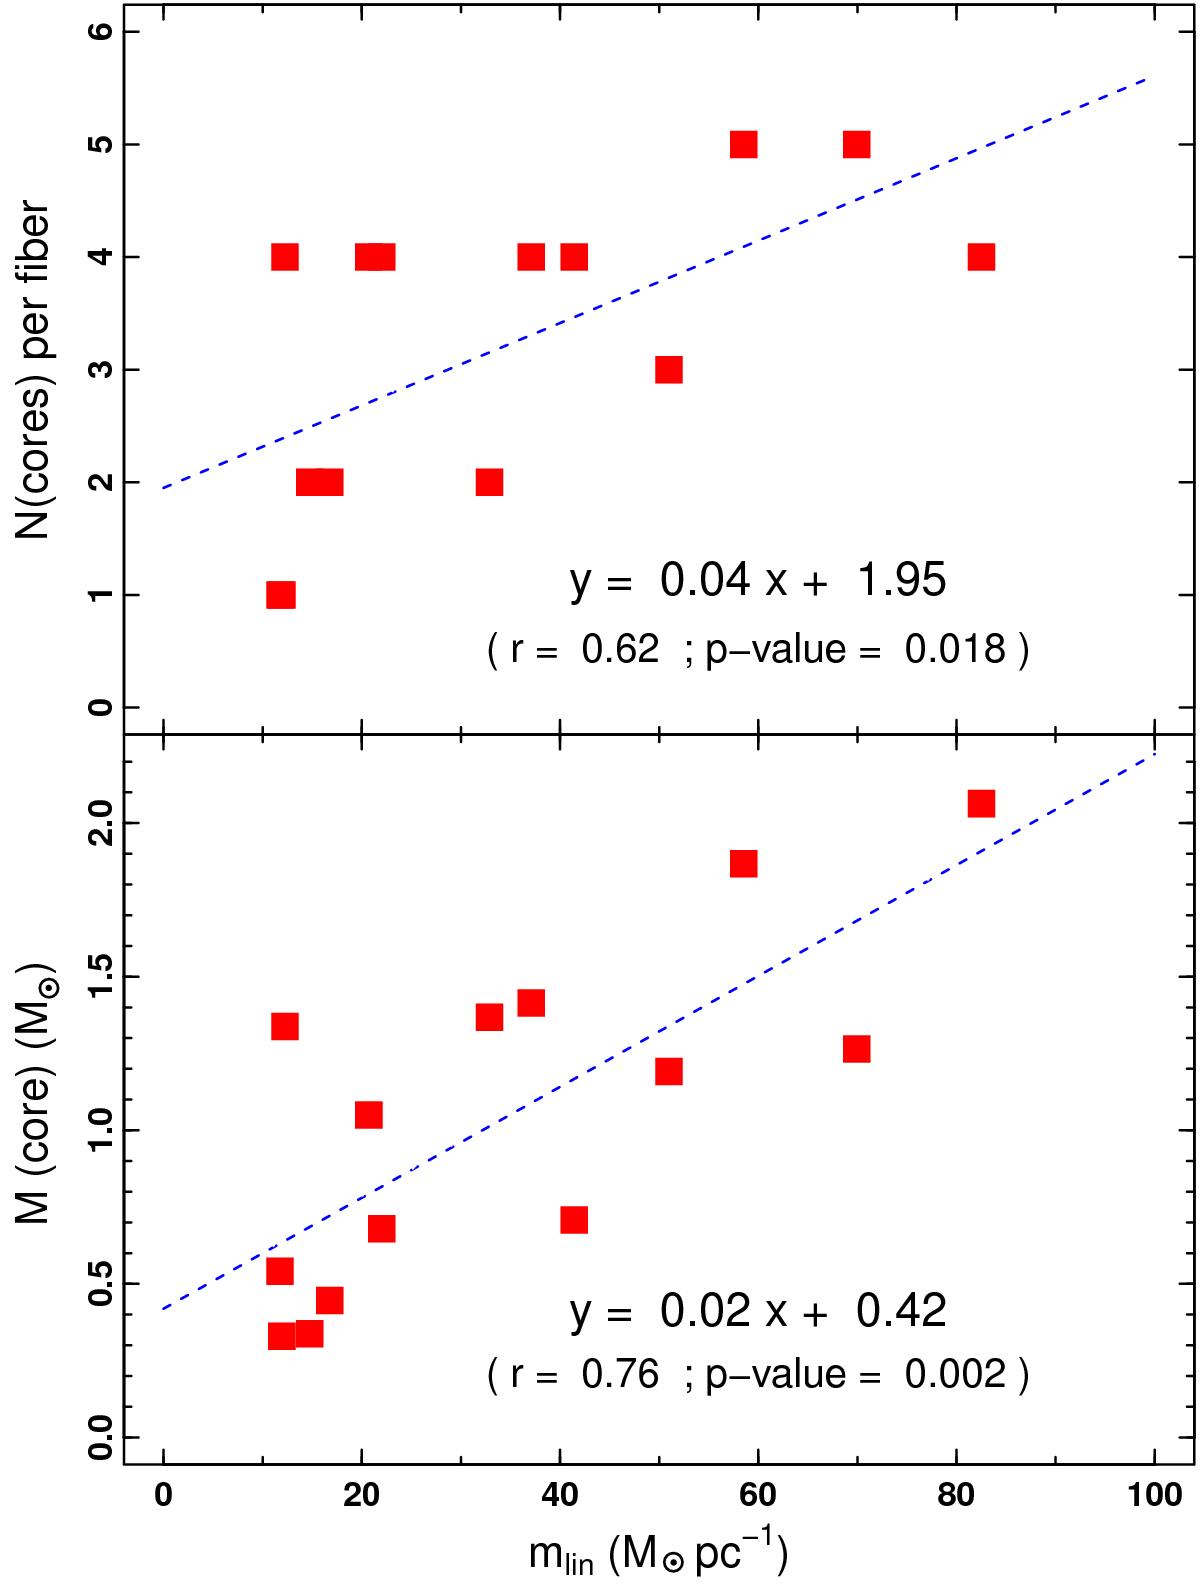
Fragmentation properties of the NGC 1333 fibers (red solid points): number of fragments (upper panel) and average core mass (lower panel) as a function of the fiber mass-per-unit-length (mlin). The results of the linear fit of the data (blue dashed line), as well as their Pearson correlation coefficient (r) and the probability of the two distributions to be drawn from a random sample (p-value), are indicated in the lower right corner of each plot.
Current usage metrics show cumulative count of Article Views (full-text article views including HTML views, PDF and ePub downloads, according to the available data) and Abstracts Views on Vision4Press platform.
Data correspond to usage on the plateform after 2015. The current usage metrics is available 48-96 hours after online publication and is updated daily on week days.
Initial download of the metrics may take a while.