Fig. 11
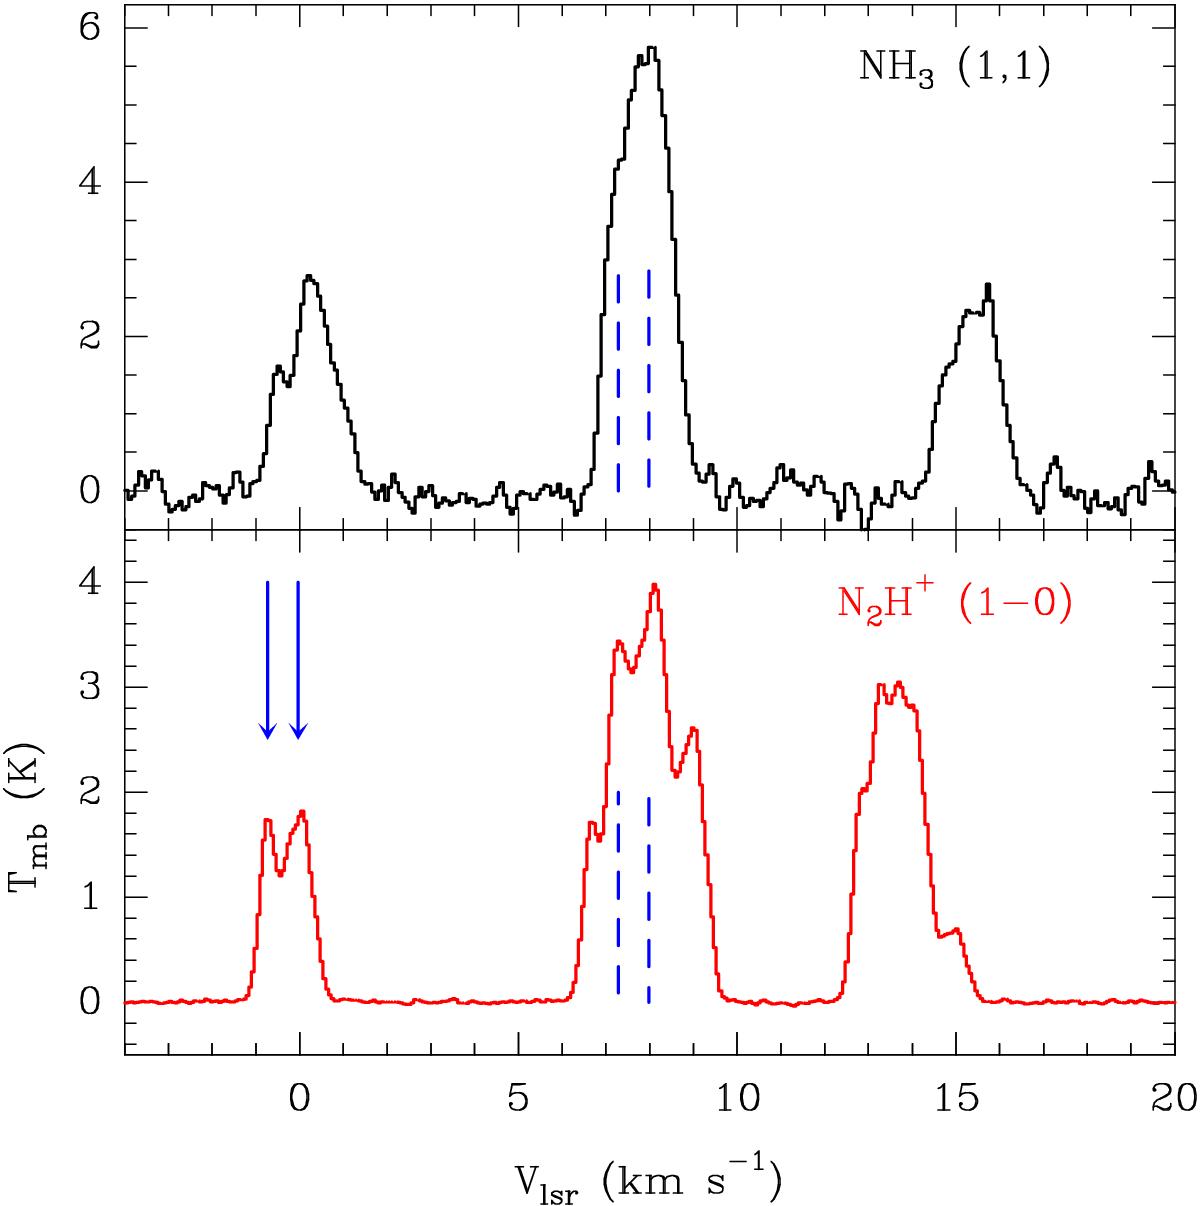
Line blending in the NH3 (1, 1) (black; upper panel) and N2H+ (1–0) (red; lower panel) spectra observed at the central position (x,y) = (0,0) of our maps. We notice how the presence of 2 overlapping velocity components is clearly resolved out in the N2H+ isolated component (blue solid arrows) while it remains undistinguishable within the main hyperfine doublet of the NH3 (1, 1) line (blue dashed lines).
Current usage metrics show cumulative count of Article Views (full-text article views including HTML views, PDF and ePub downloads, according to the available data) and Abstracts Views on Vision4Press platform.
Data correspond to usage on the plateform after 2015. The current usage metrics is available 48-96 hours after online publication and is updated daily on week days.
Initial download of the metrics may take a while.