Fig. 10
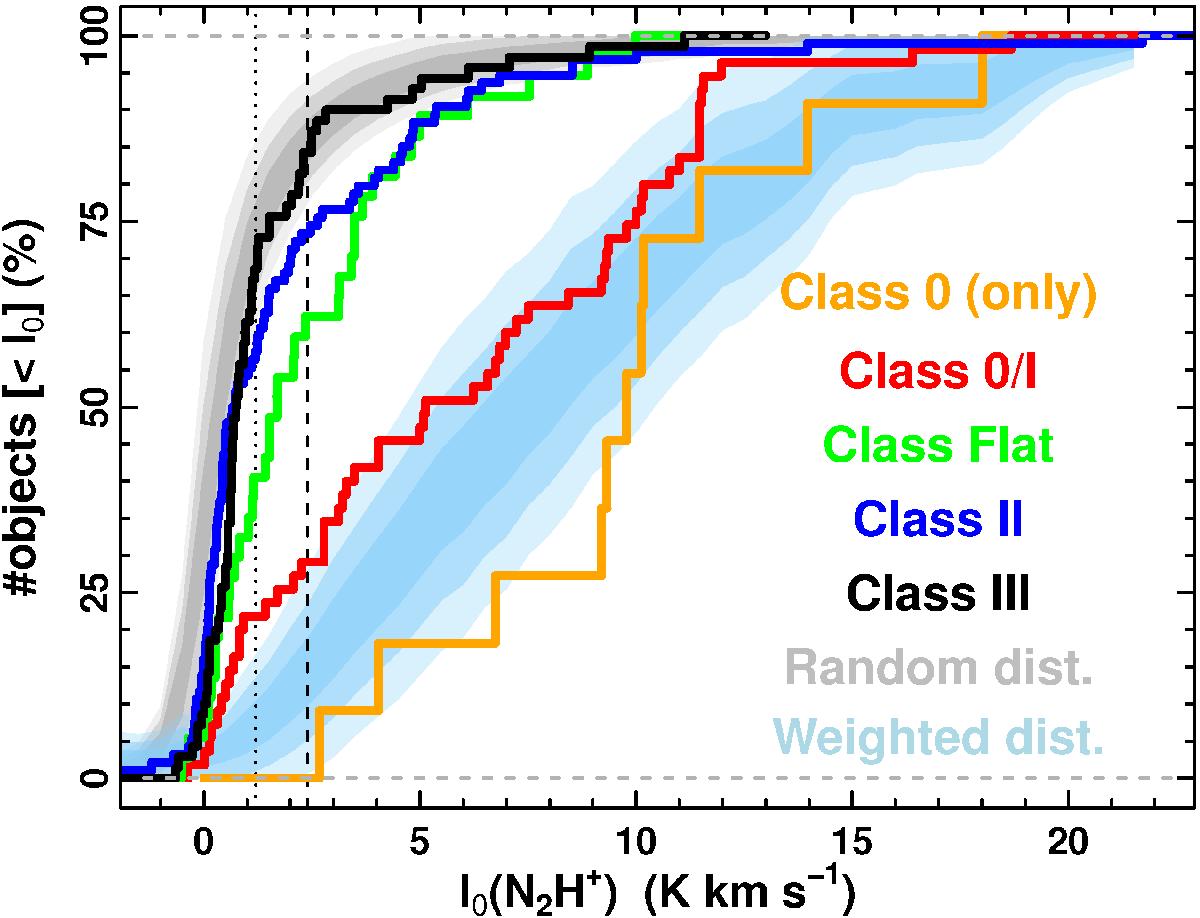
Cumulative fraction of stars as a function of the N2H+ intensity (I0). The distribution of Class 0 (orange), Class 0/I (i.e., all protostars; red), and Classes Flat (green), II (blue), and III (black) are independently displayed. The two shaded areas (with 1σ, 2σ, and 3σ contours) correspond to the cumulative fraction of objects resulting from random distribution of objects (grey) and a distribution where the probability of finding an object is proportional to the second power of the N2H+ intensity (light blue) (see text). The two vertical lines define the N2H+ intensity of the first (dotted line) and second (dashed line) contours in Fig. 5, respectively.
Current usage metrics show cumulative count of Article Views (full-text article views including HTML views, PDF and ePub downloads, according to the available data) and Abstracts Views on Vision4Press platform.
Data correspond to usage on the plateform after 2015. The current usage metrics is available 48-96 hours after online publication and is updated daily on week days.
Initial download of the metrics may take a while.