Fig. 1
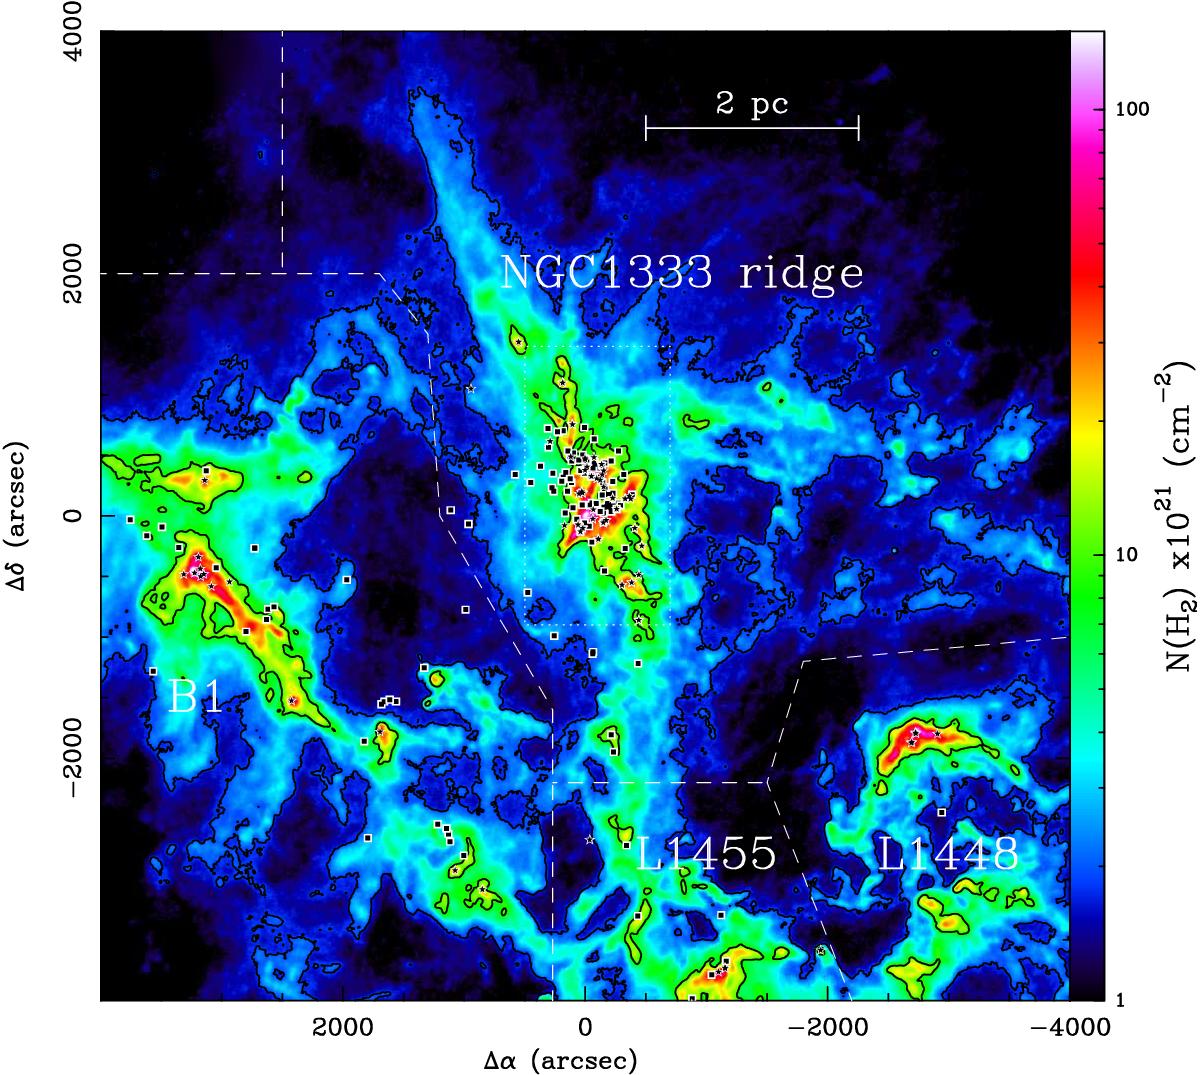
Large scale view of the NGC 1333 ridge in Perseus. The image represents the total column density map derived from our Herschel-Planck maps (in colour scale), including two contours of equivalent column densities of AV = 2mag and 10mag, respectively. Offsets are referred to the map centre with coordinates ![]() in radio projection. The four subregions around NGC 1333 and their boundaries are labelled in the plot. The different symbols correspond to the Class 0/I (stars) and Flat/ClassII/III objects (squares) identified by different Spitzer surveys (Gutermuth et al. 2008; Evans et al. 2009). The dotted line encloses the NGC 1333 clump studied in this work.
in radio projection. The four subregions around NGC 1333 and their boundaries are labelled in the plot. The different symbols correspond to the Class 0/I (stars) and Flat/ClassII/III objects (squares) identified by different Spitzer surveys (Gutermuth et al. 2008; Evans et al. 2009). The dotted line encloses the NGC 1333 clump studied in this work.
Current usage metrics show cumulative count of Article Views (full-text article views including HTML views, PDF and ePub downloads, according to the available data) and Abstracts Views on Vision4Press platform.
Data correspond to usage on the plateform after 2015. The current usage metrics is available 48-96 hours after online publication and is updated daily on week days.
Initial download of the metrics may take a while.