Fig. 15
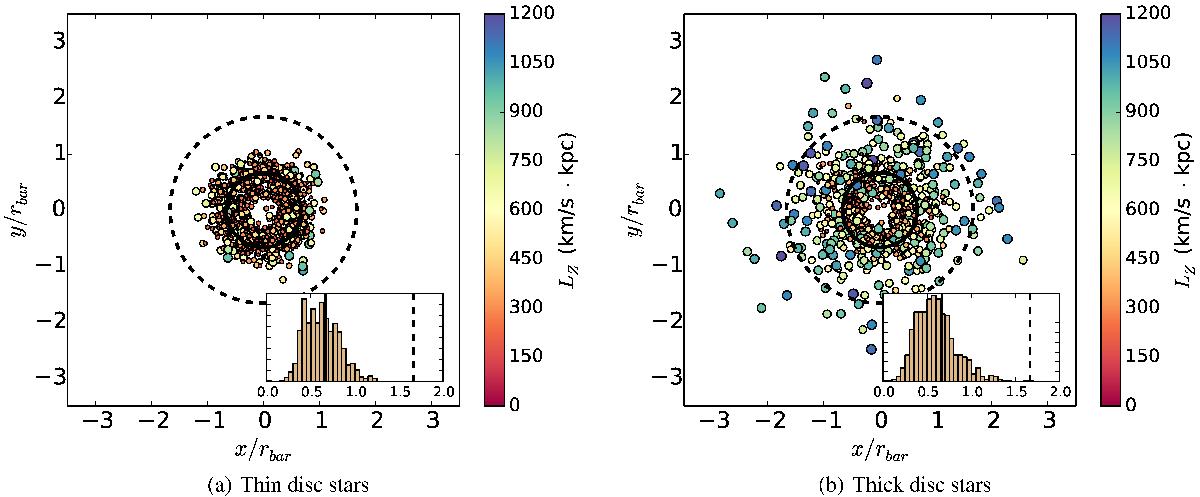
Instantaneous position of particles selected near the edge of the bar (shaded regions in Fig. 2) at the start of the simulation for the thin (left) and thick (right) disc. The x- and y-axis are normalised to the bar length rbar. The solid black circle gives the average radius of these stars at the end of the simulation and the dashed black circle delineates the OLR. The inset shows a histogram of the guiding radii of these stars at the start of the simulation. The guiding radii of the thin disc stars are quite similar to the instantaneous radius of the particles, while the guiding radii of the thick disc stars are limited to a smaller range than the instantaneous positions because these stars have larger radial excursions. The size and colour of the points indicate the angular momentum of these particles at the end of the simulation. The stars born at larger radii are also the ones that have larger angular momenta at the end of the simulation.
Current usage metrics show cumulative count of Article Views (full-text article views including HTML views, PDF and ePub downloads, according to the available data) and Abstracts Views on Vision4Press platform.
Data correspond to usage on the plateform after 2015. The current usage metrics is available 48-96 hours after online publication and is updated daily on week days.
Initial download of the metrics may take a while.