Fig. 14
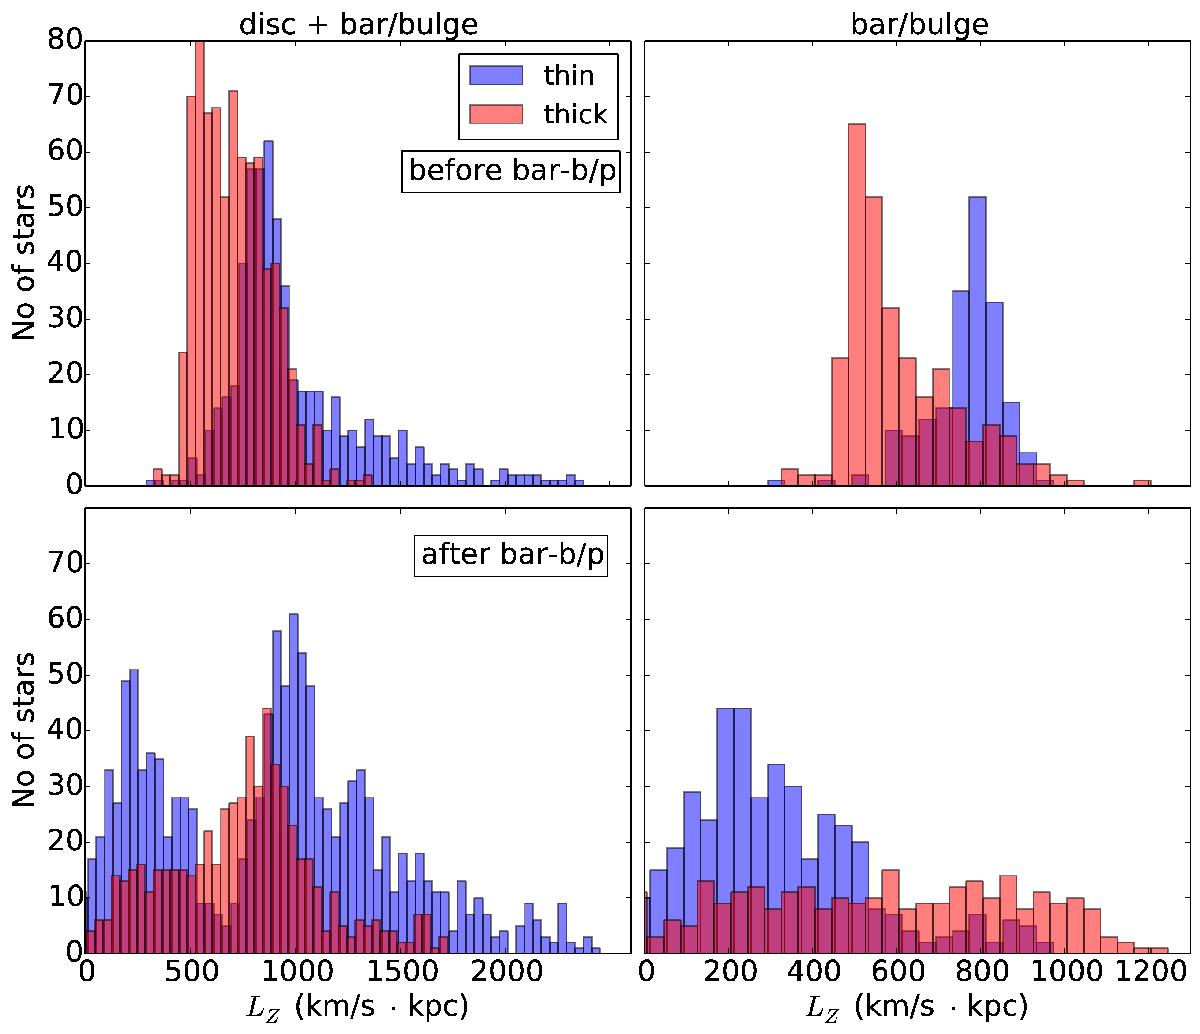
Angular momentum distribution of the thin (blue) and thick (red) disc particles. Left: particles are chosen from a region including the disc and bar, i.e. x = 3.2–3.5 kpc, z = 0.2–0.5 kpc, and y = − 8–8 kpc (unshaded region of Fig. 2). In these plots the foreground and background disc contamination are explicitly included. Right: angular momentum distribution of the thin (blue) and thick (red) disc particles in the bar-b/p region, i.e. x = 3.2–3.5 kpc, z = 0.2–0.5 kpc, and y = − 1–1 kpc (shaded region in Fig. 2). The top row shows the angular momenta for the first snapshot when the disc is axisymmetric, i.e. before the bar and b/p bulge form, while the bottom row shows the angular momenta after bar and b/p formation. Focusing on the particles in the bar/bulge region after the bar and b/p form (bottom right panel), we note that the thick disc particles have a tail of higher angular momentum than the thin disc stars.
Current usage metrics show cumulative count of Article Views (full-text article views including HTML views, PDF and ePub downloads, according to the available data) and Abstracts Views on Vision4Press platform.
Data correspond to usage on the plateform after 2015. The current usage metrics is available 48-96 hours after online publication and is updated daily on week days.
Initial download of the metrics may take a while.