Free Access
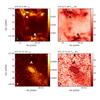
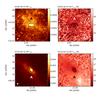
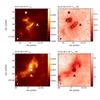
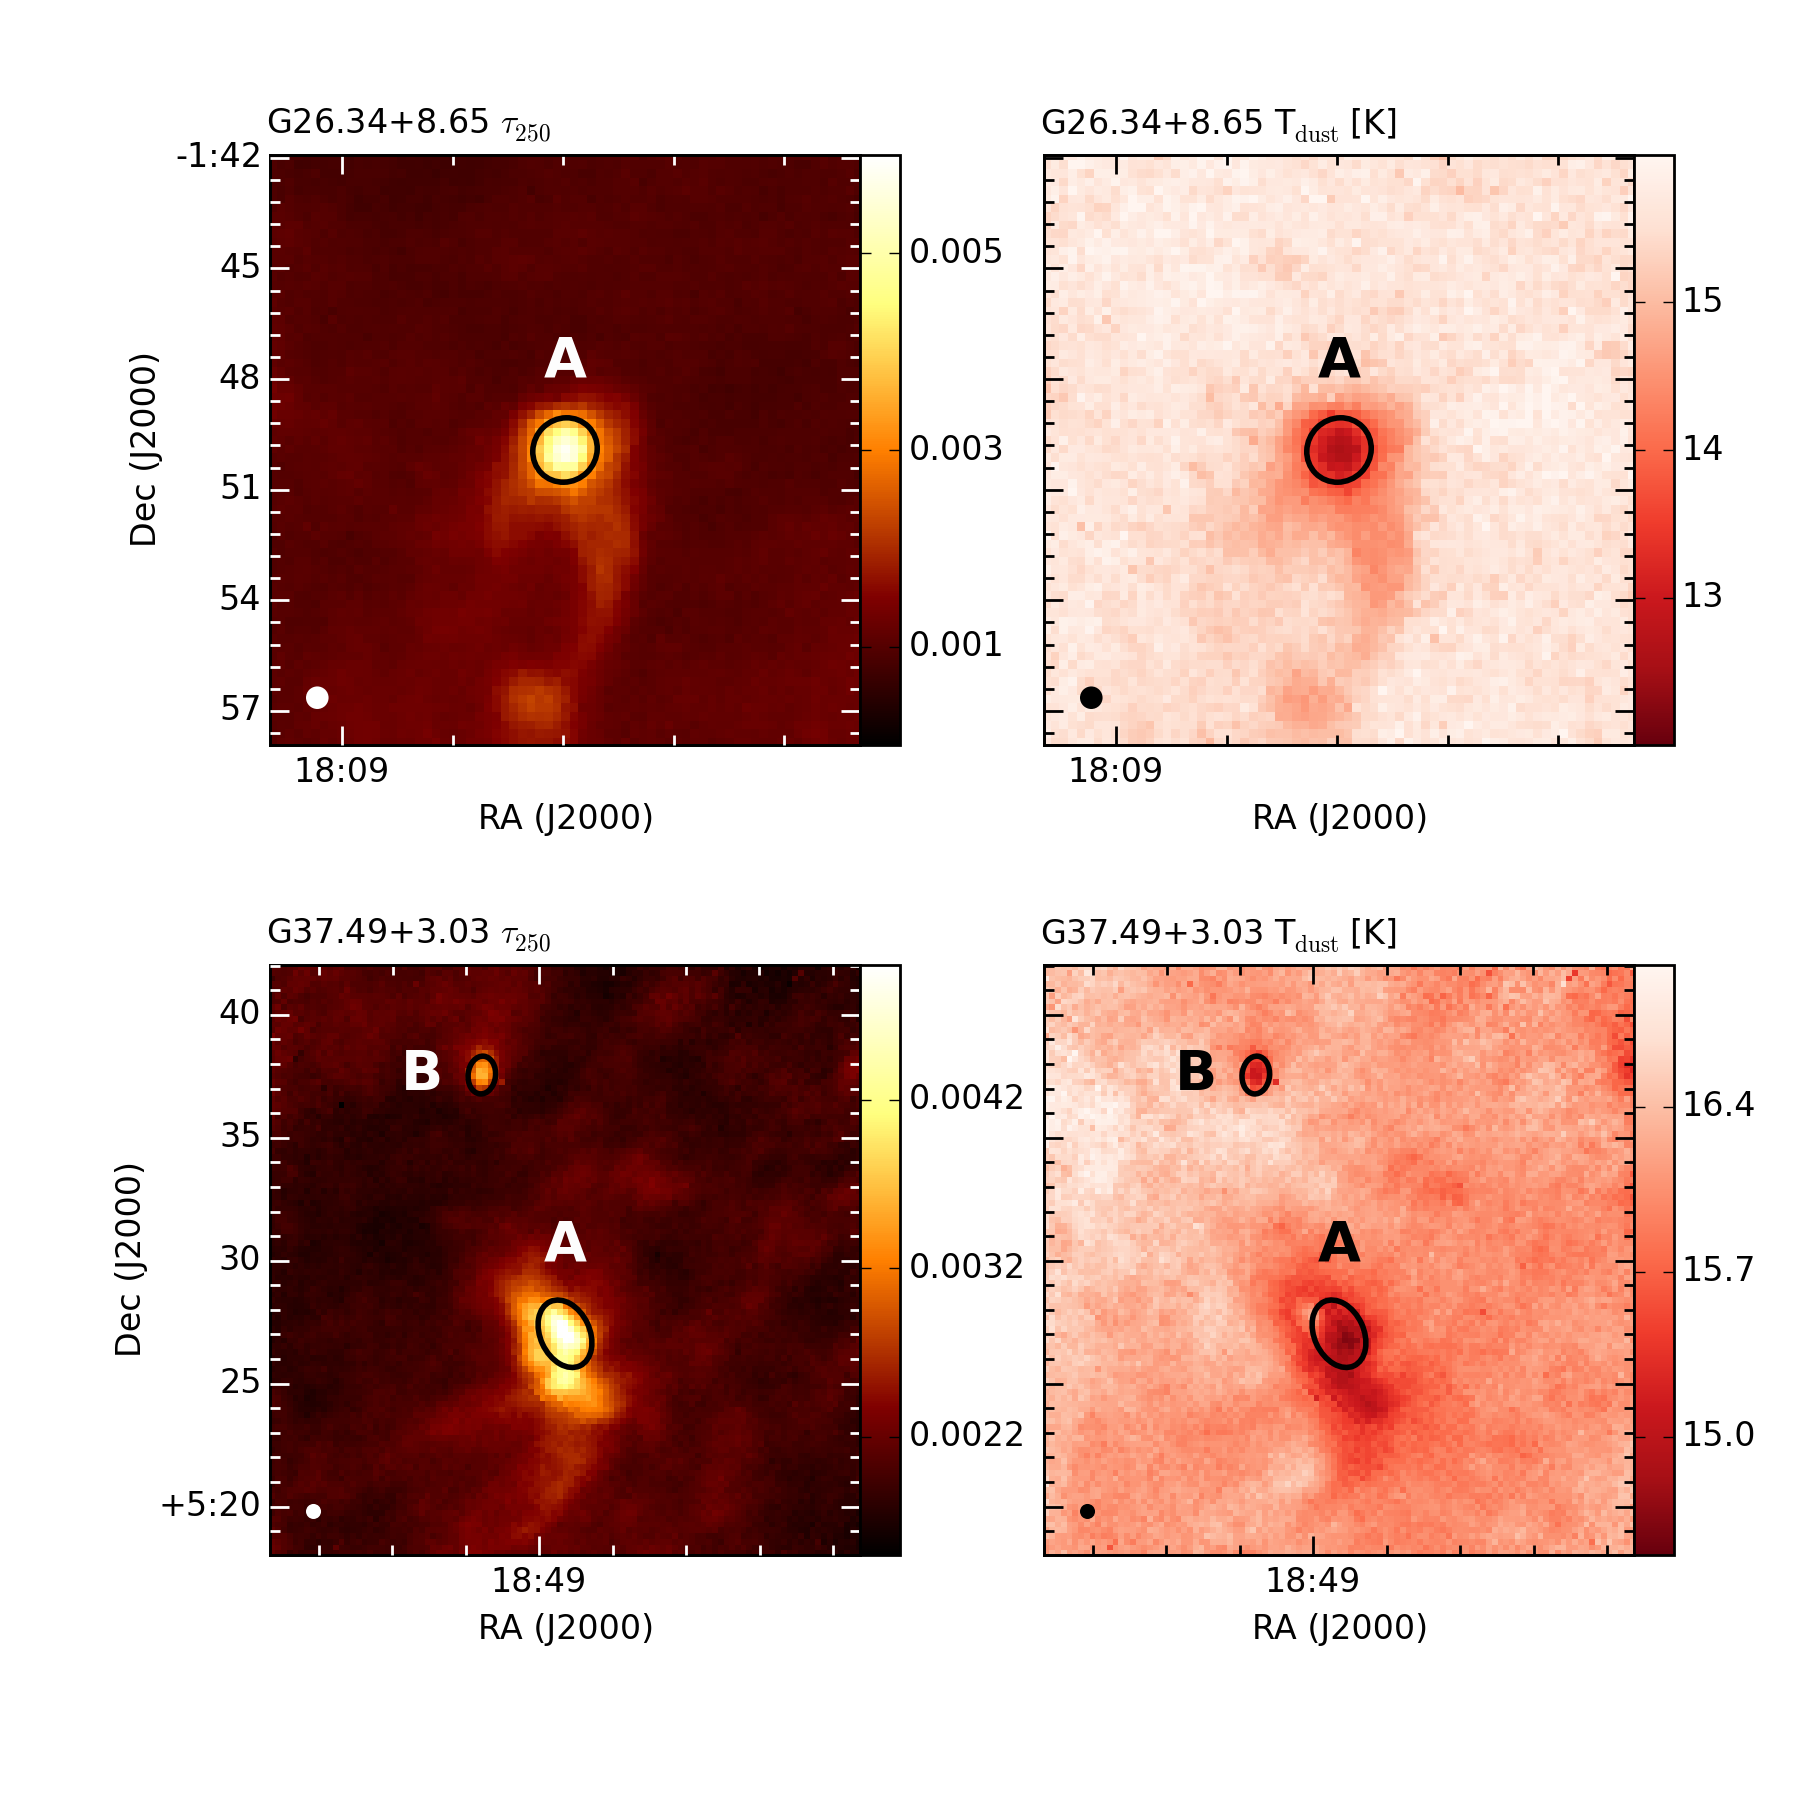
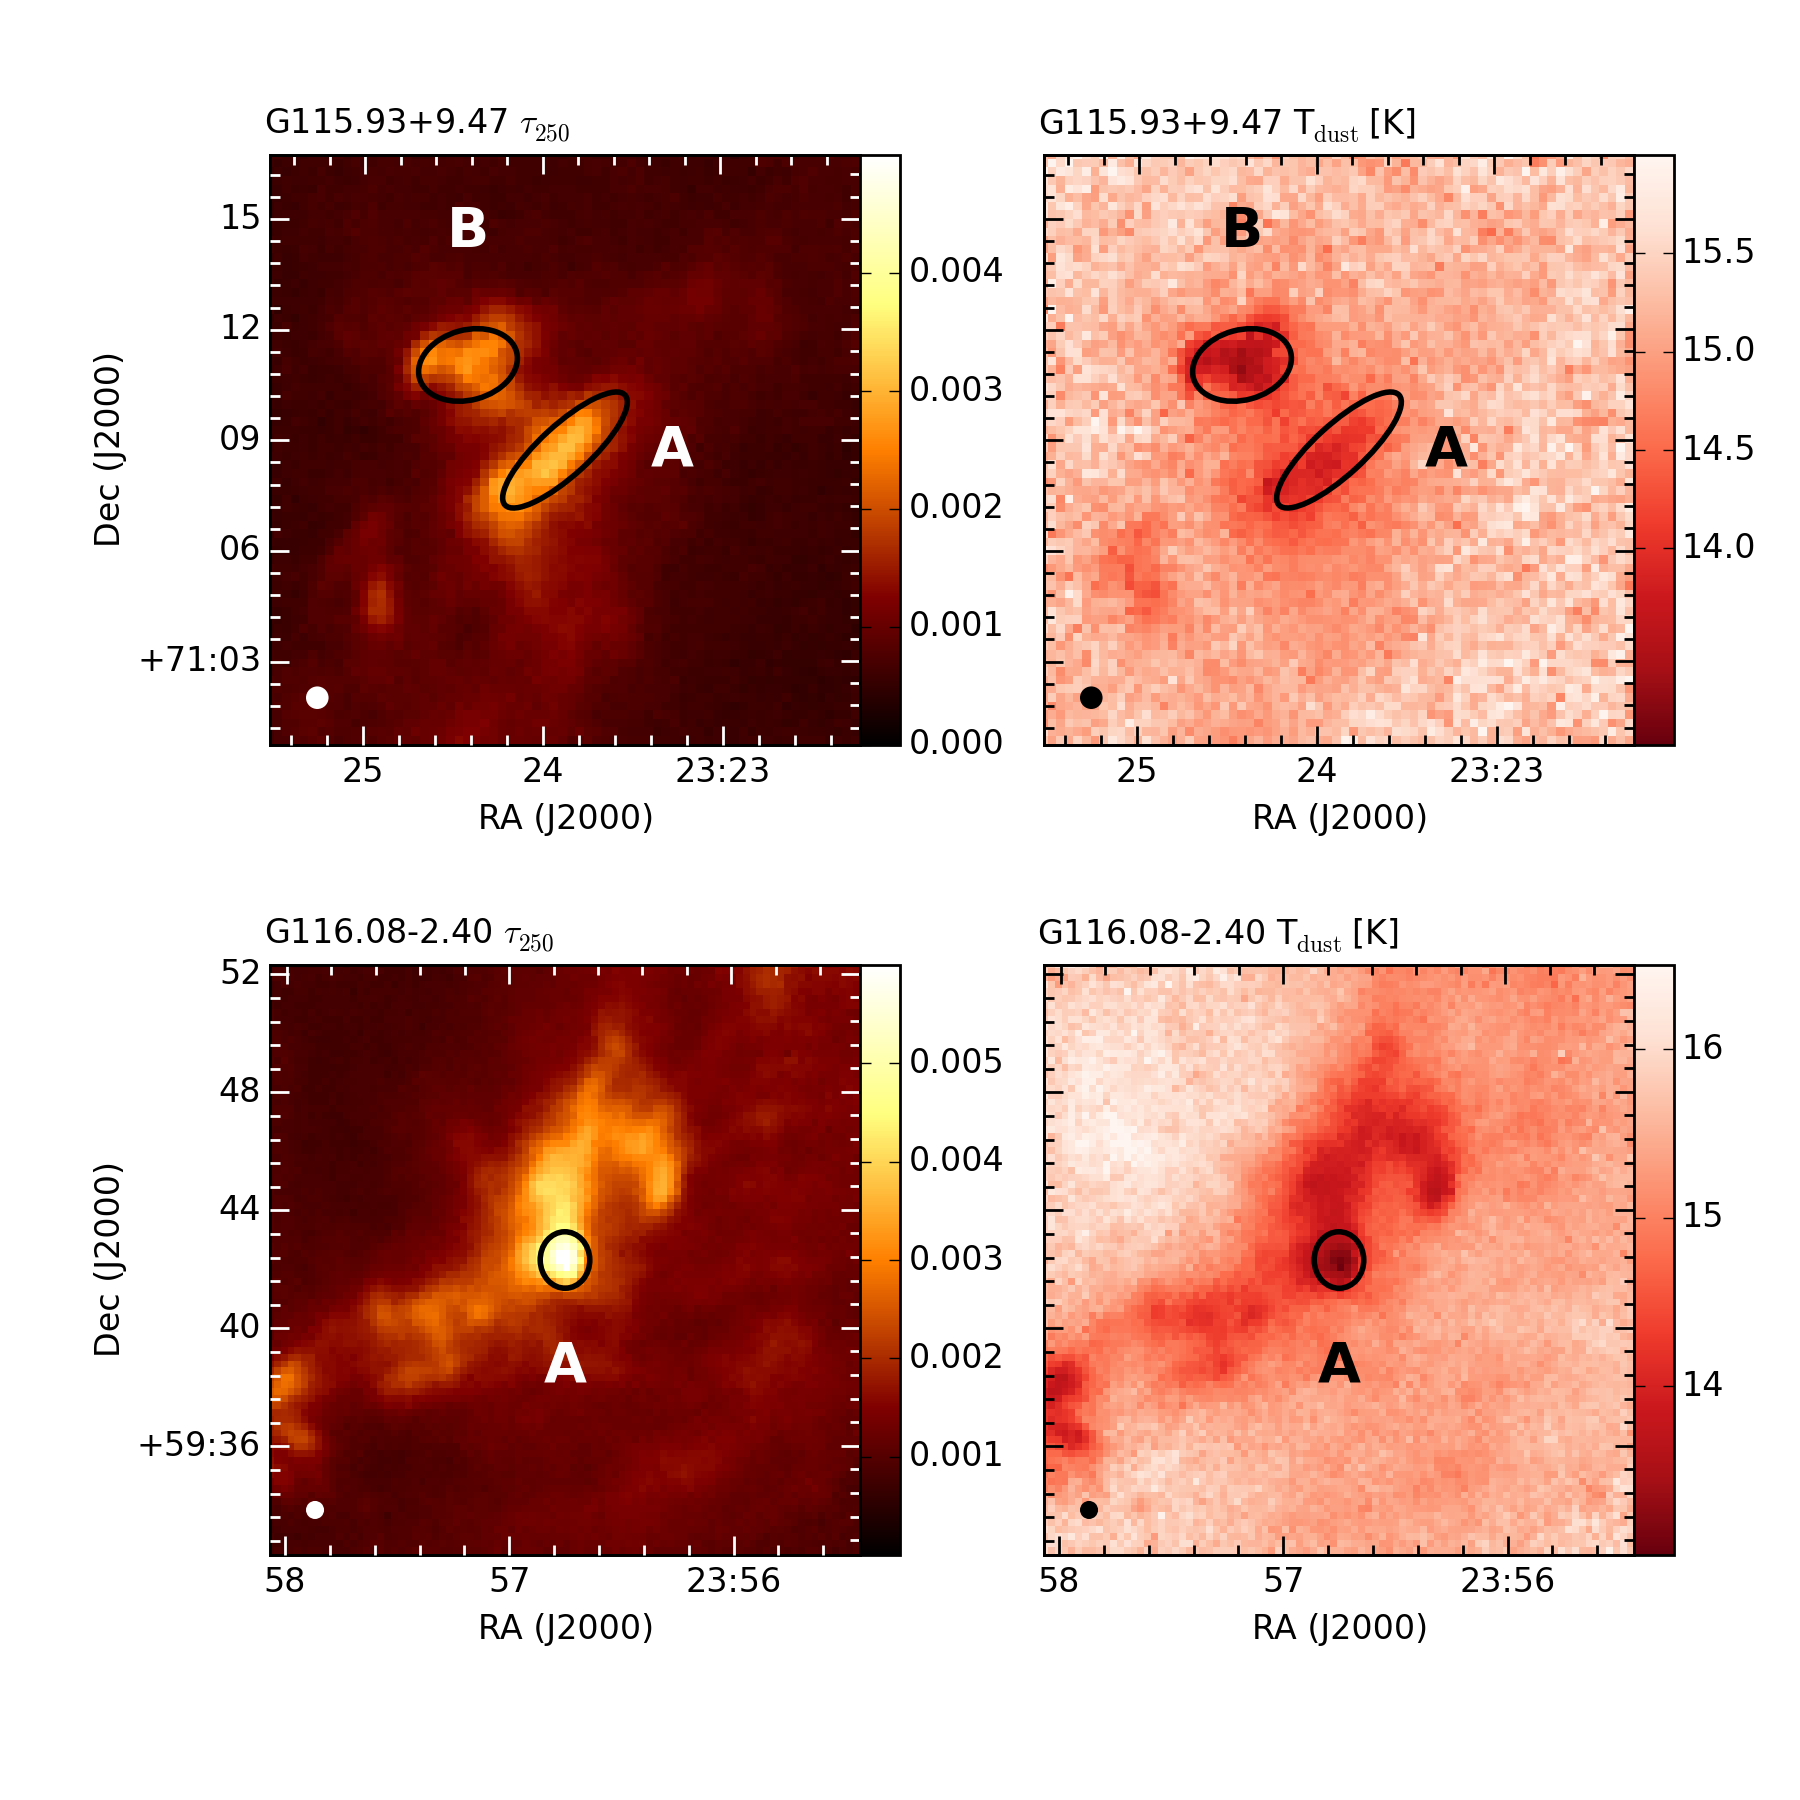
Fig. B.1
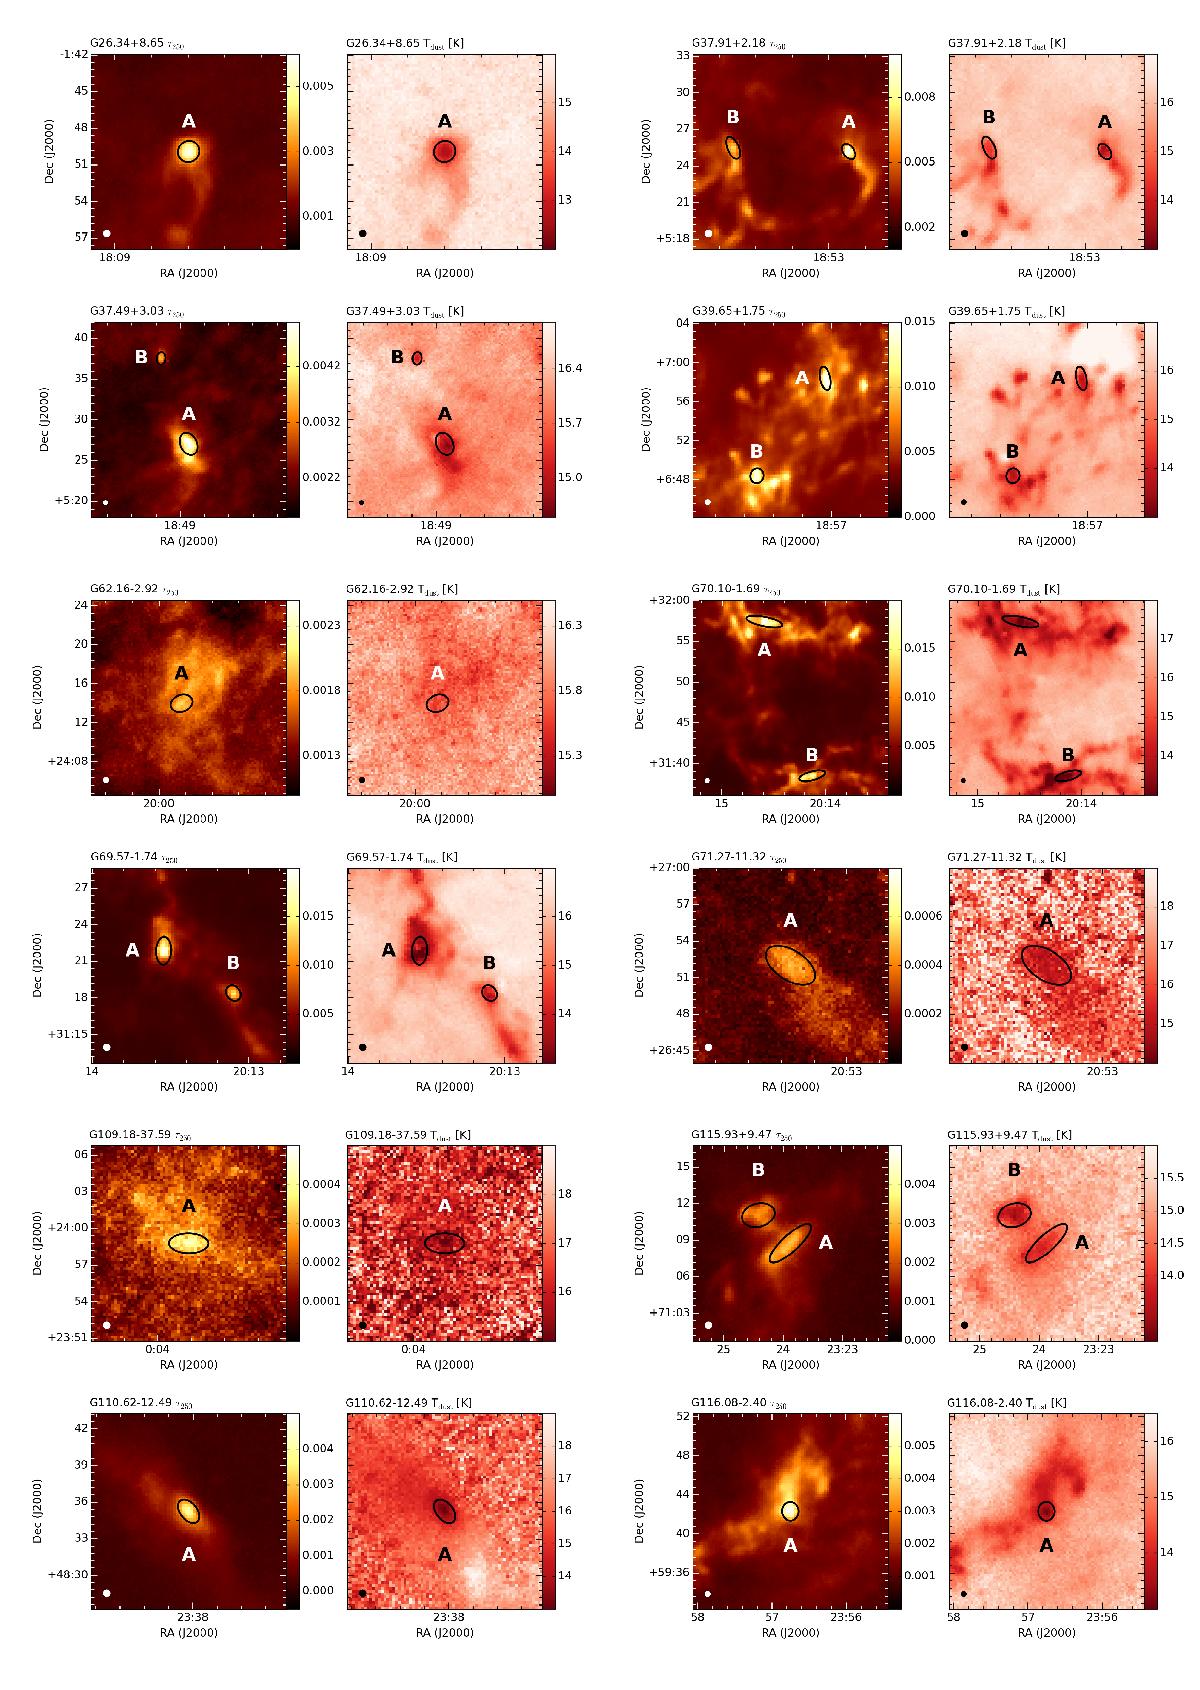
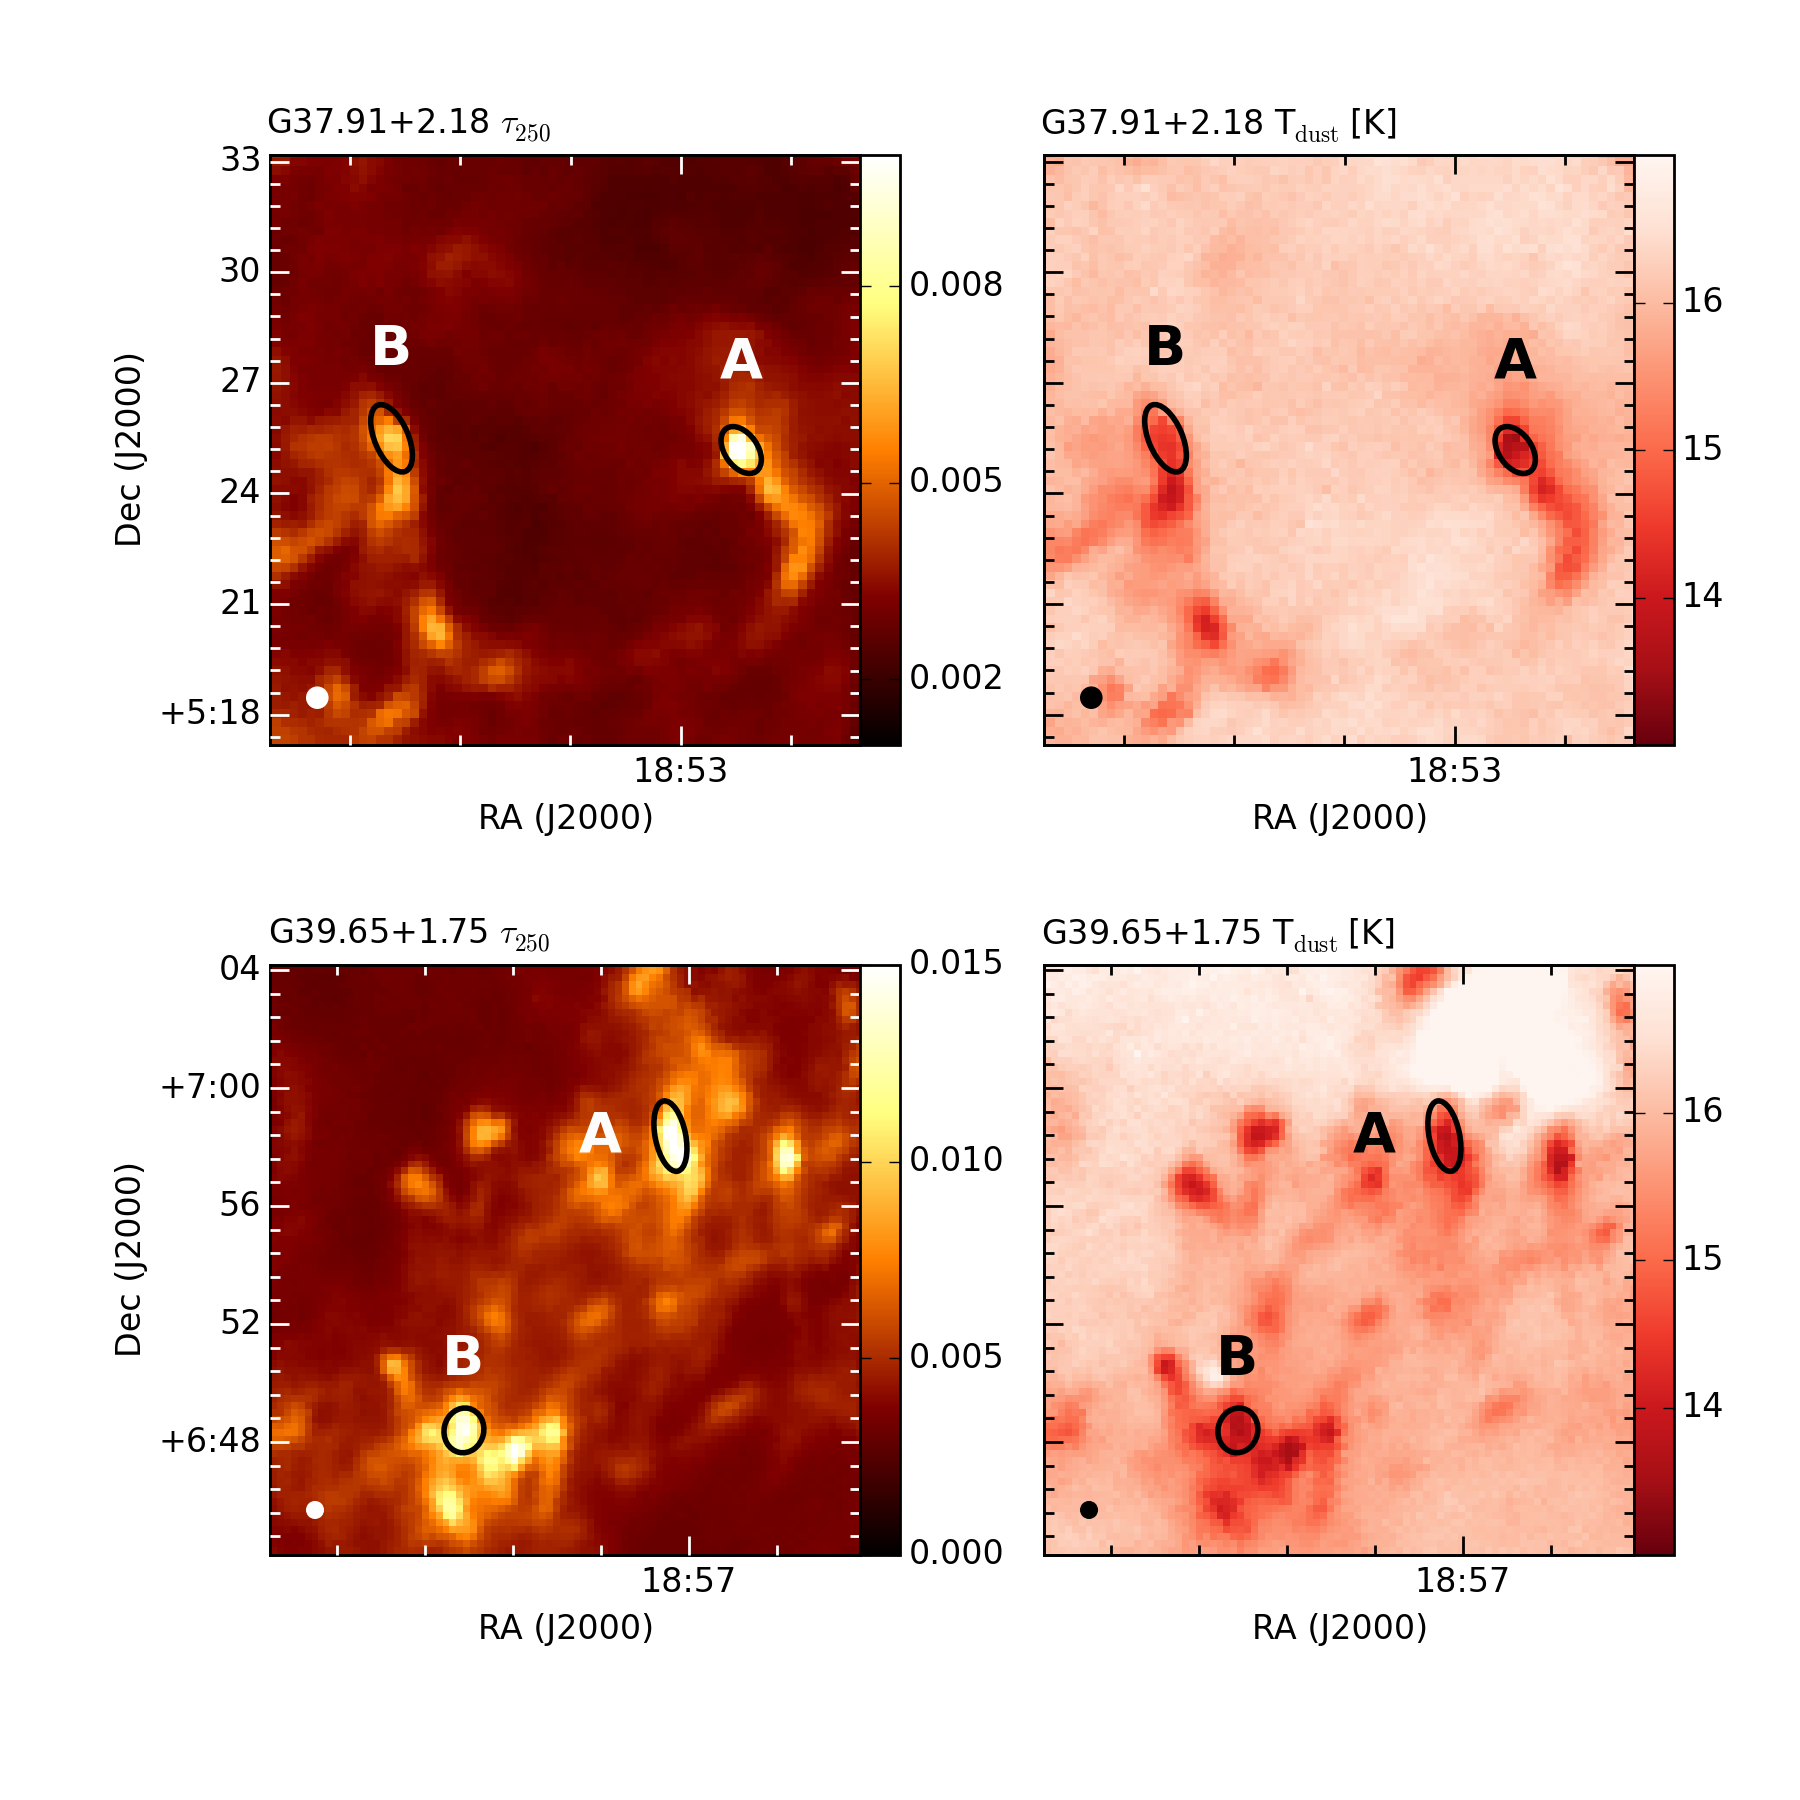
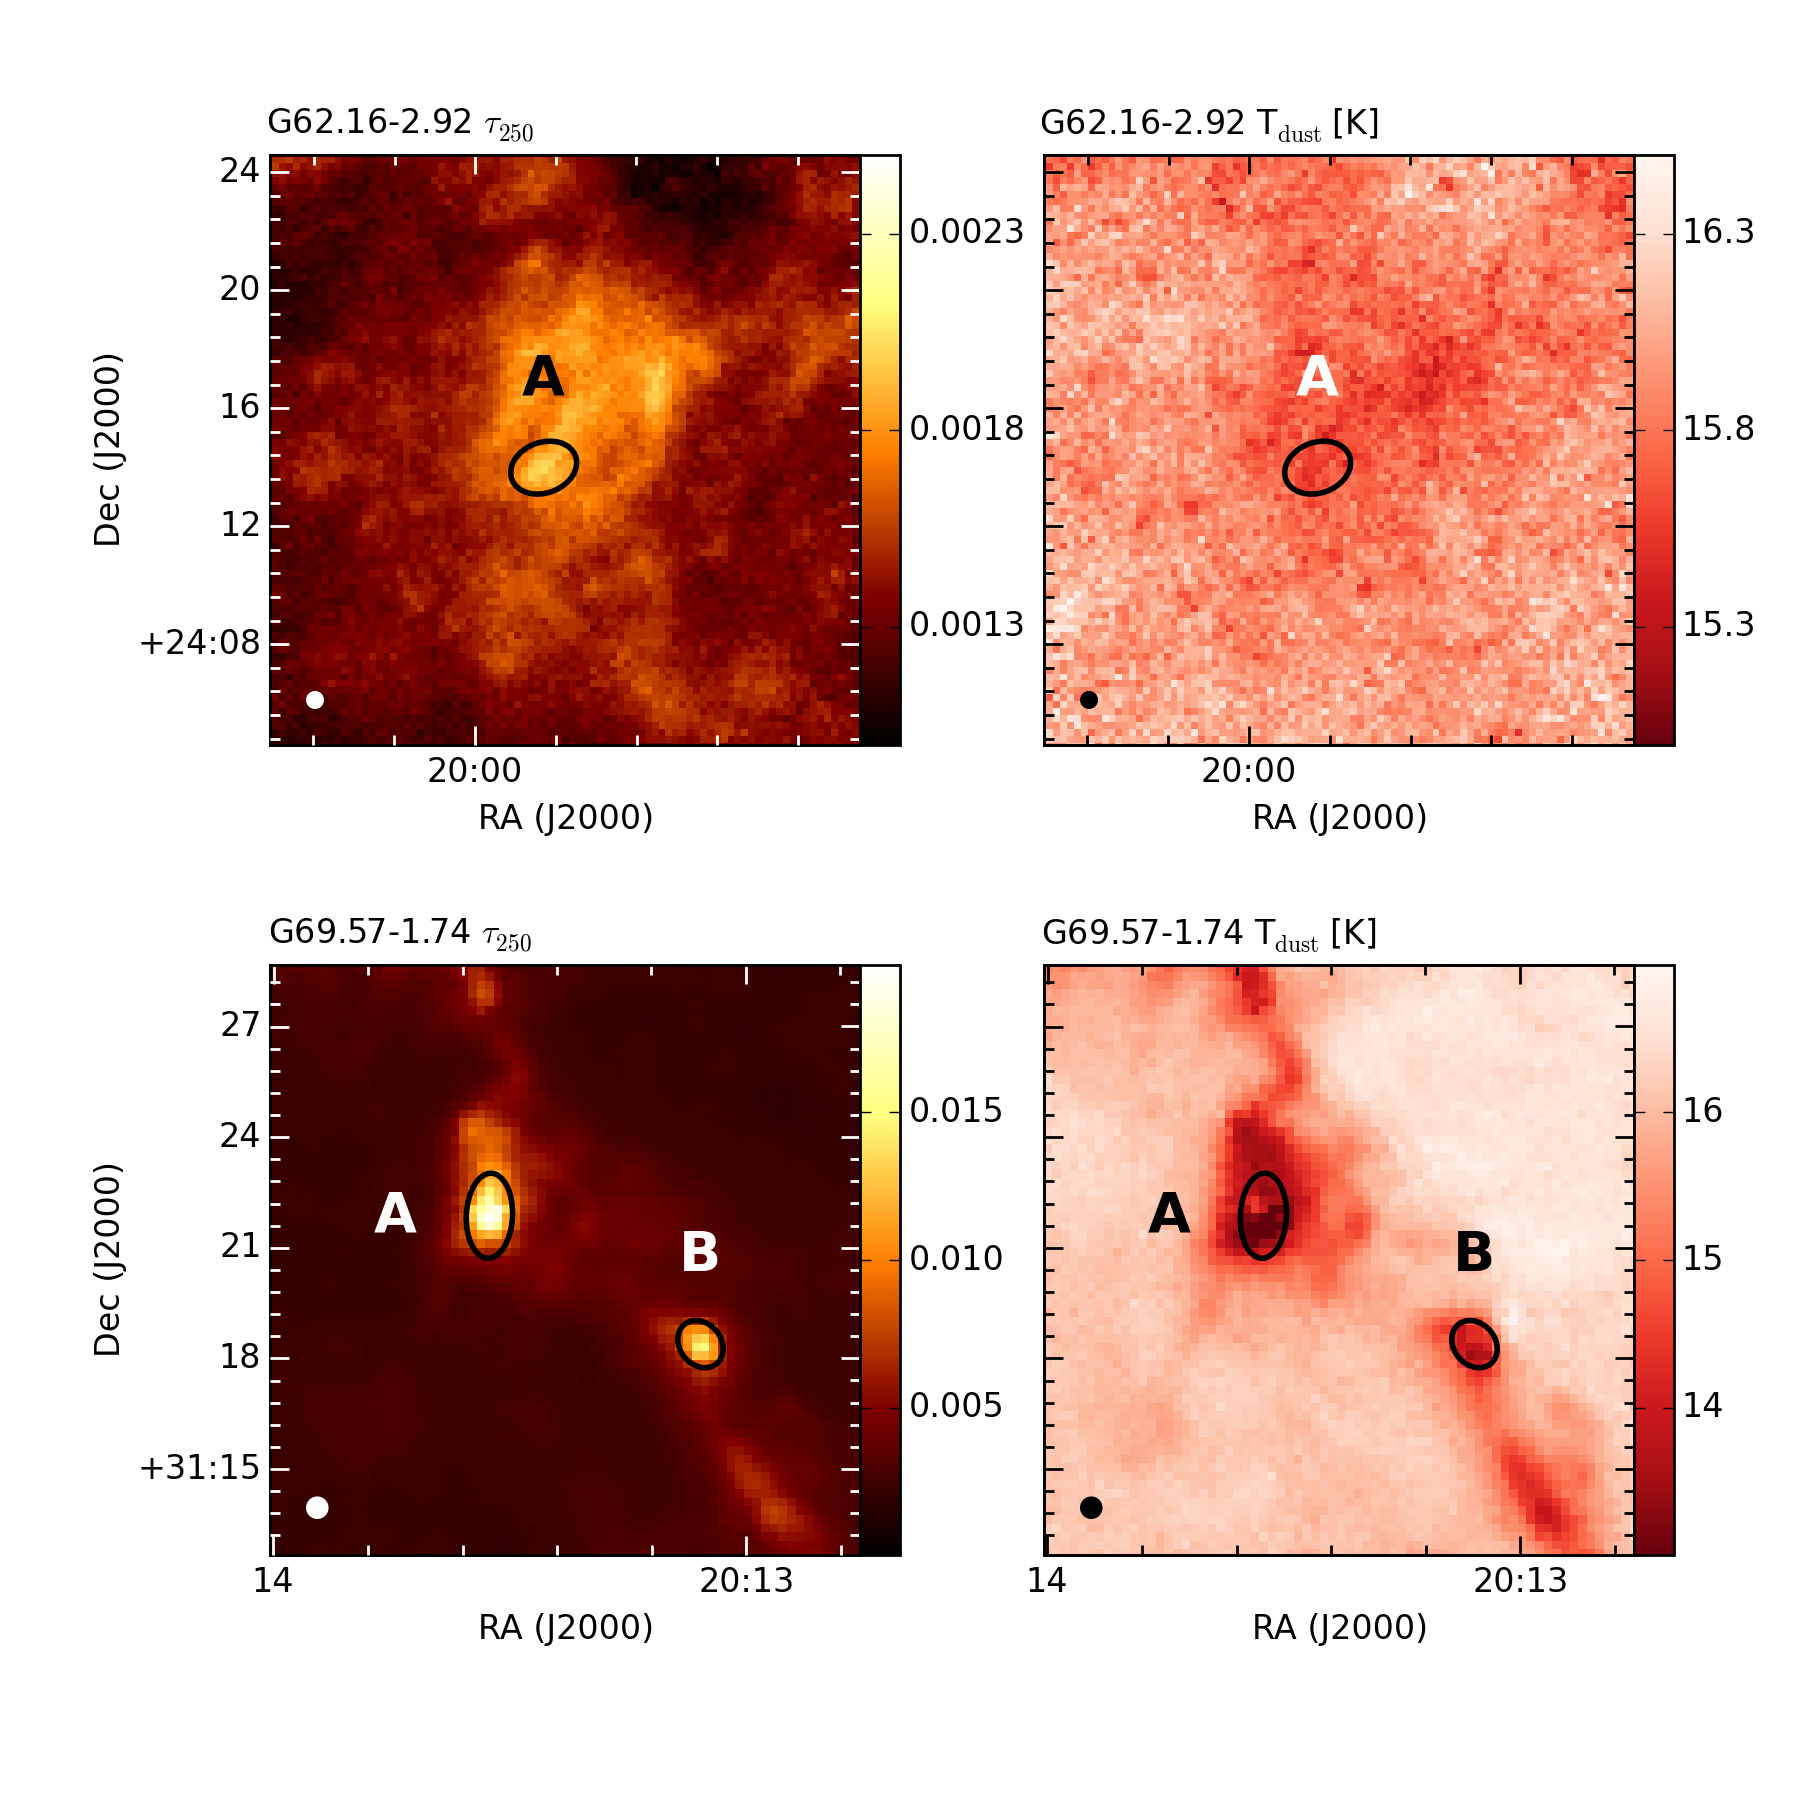
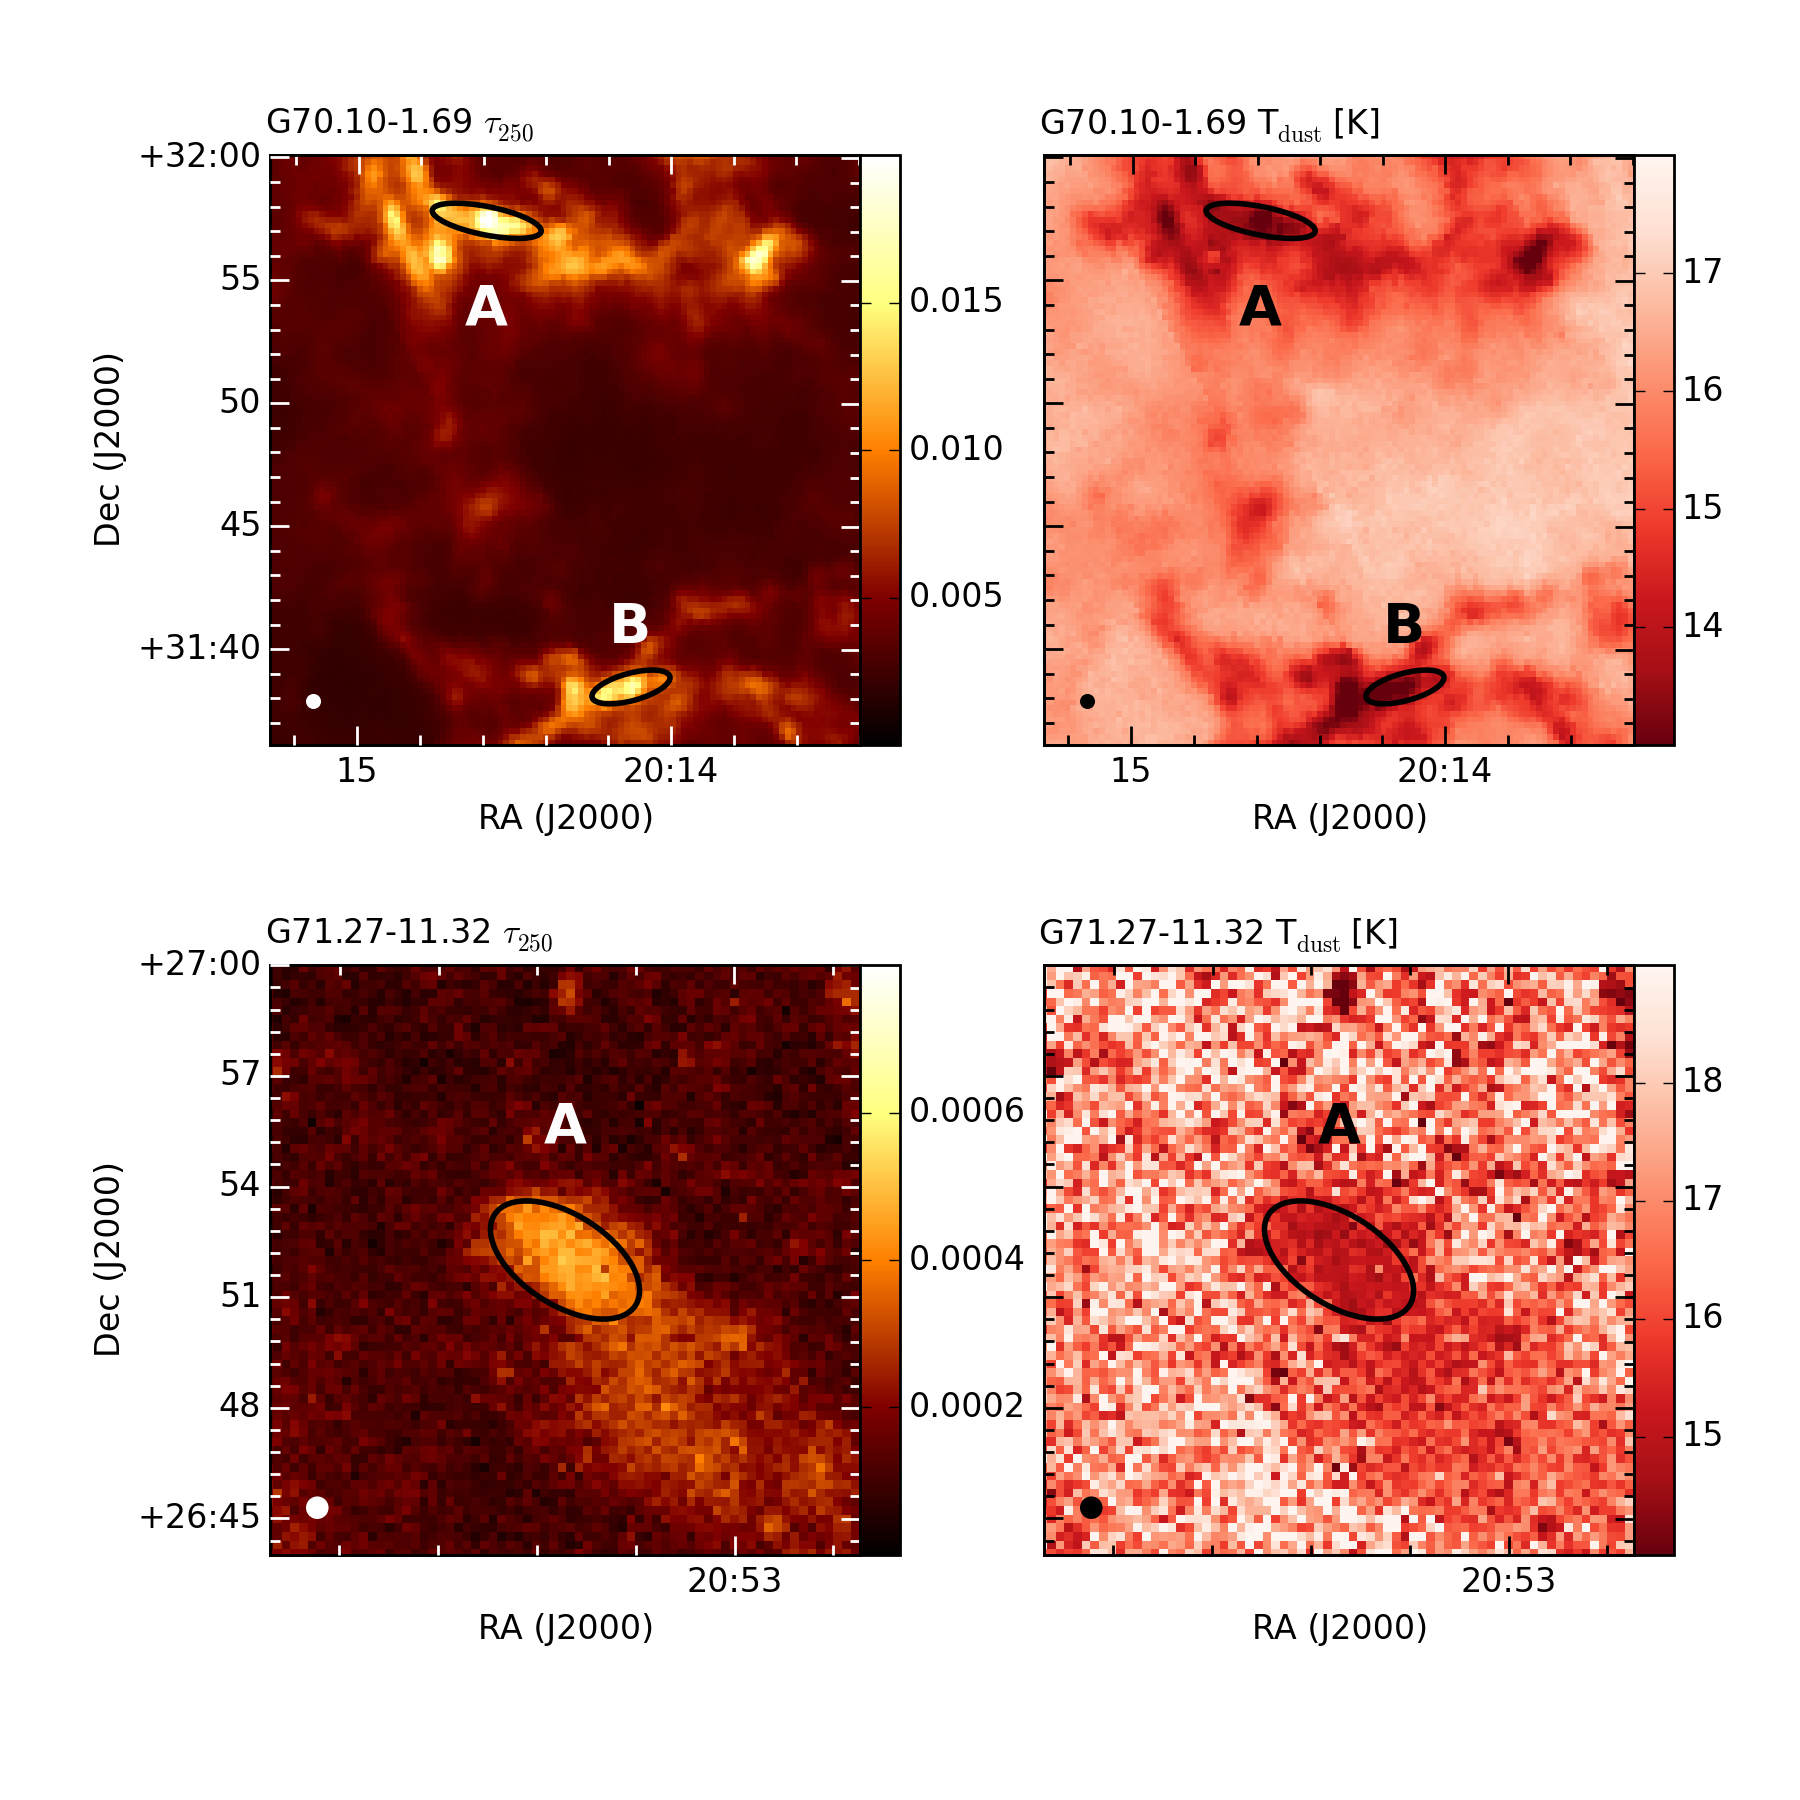
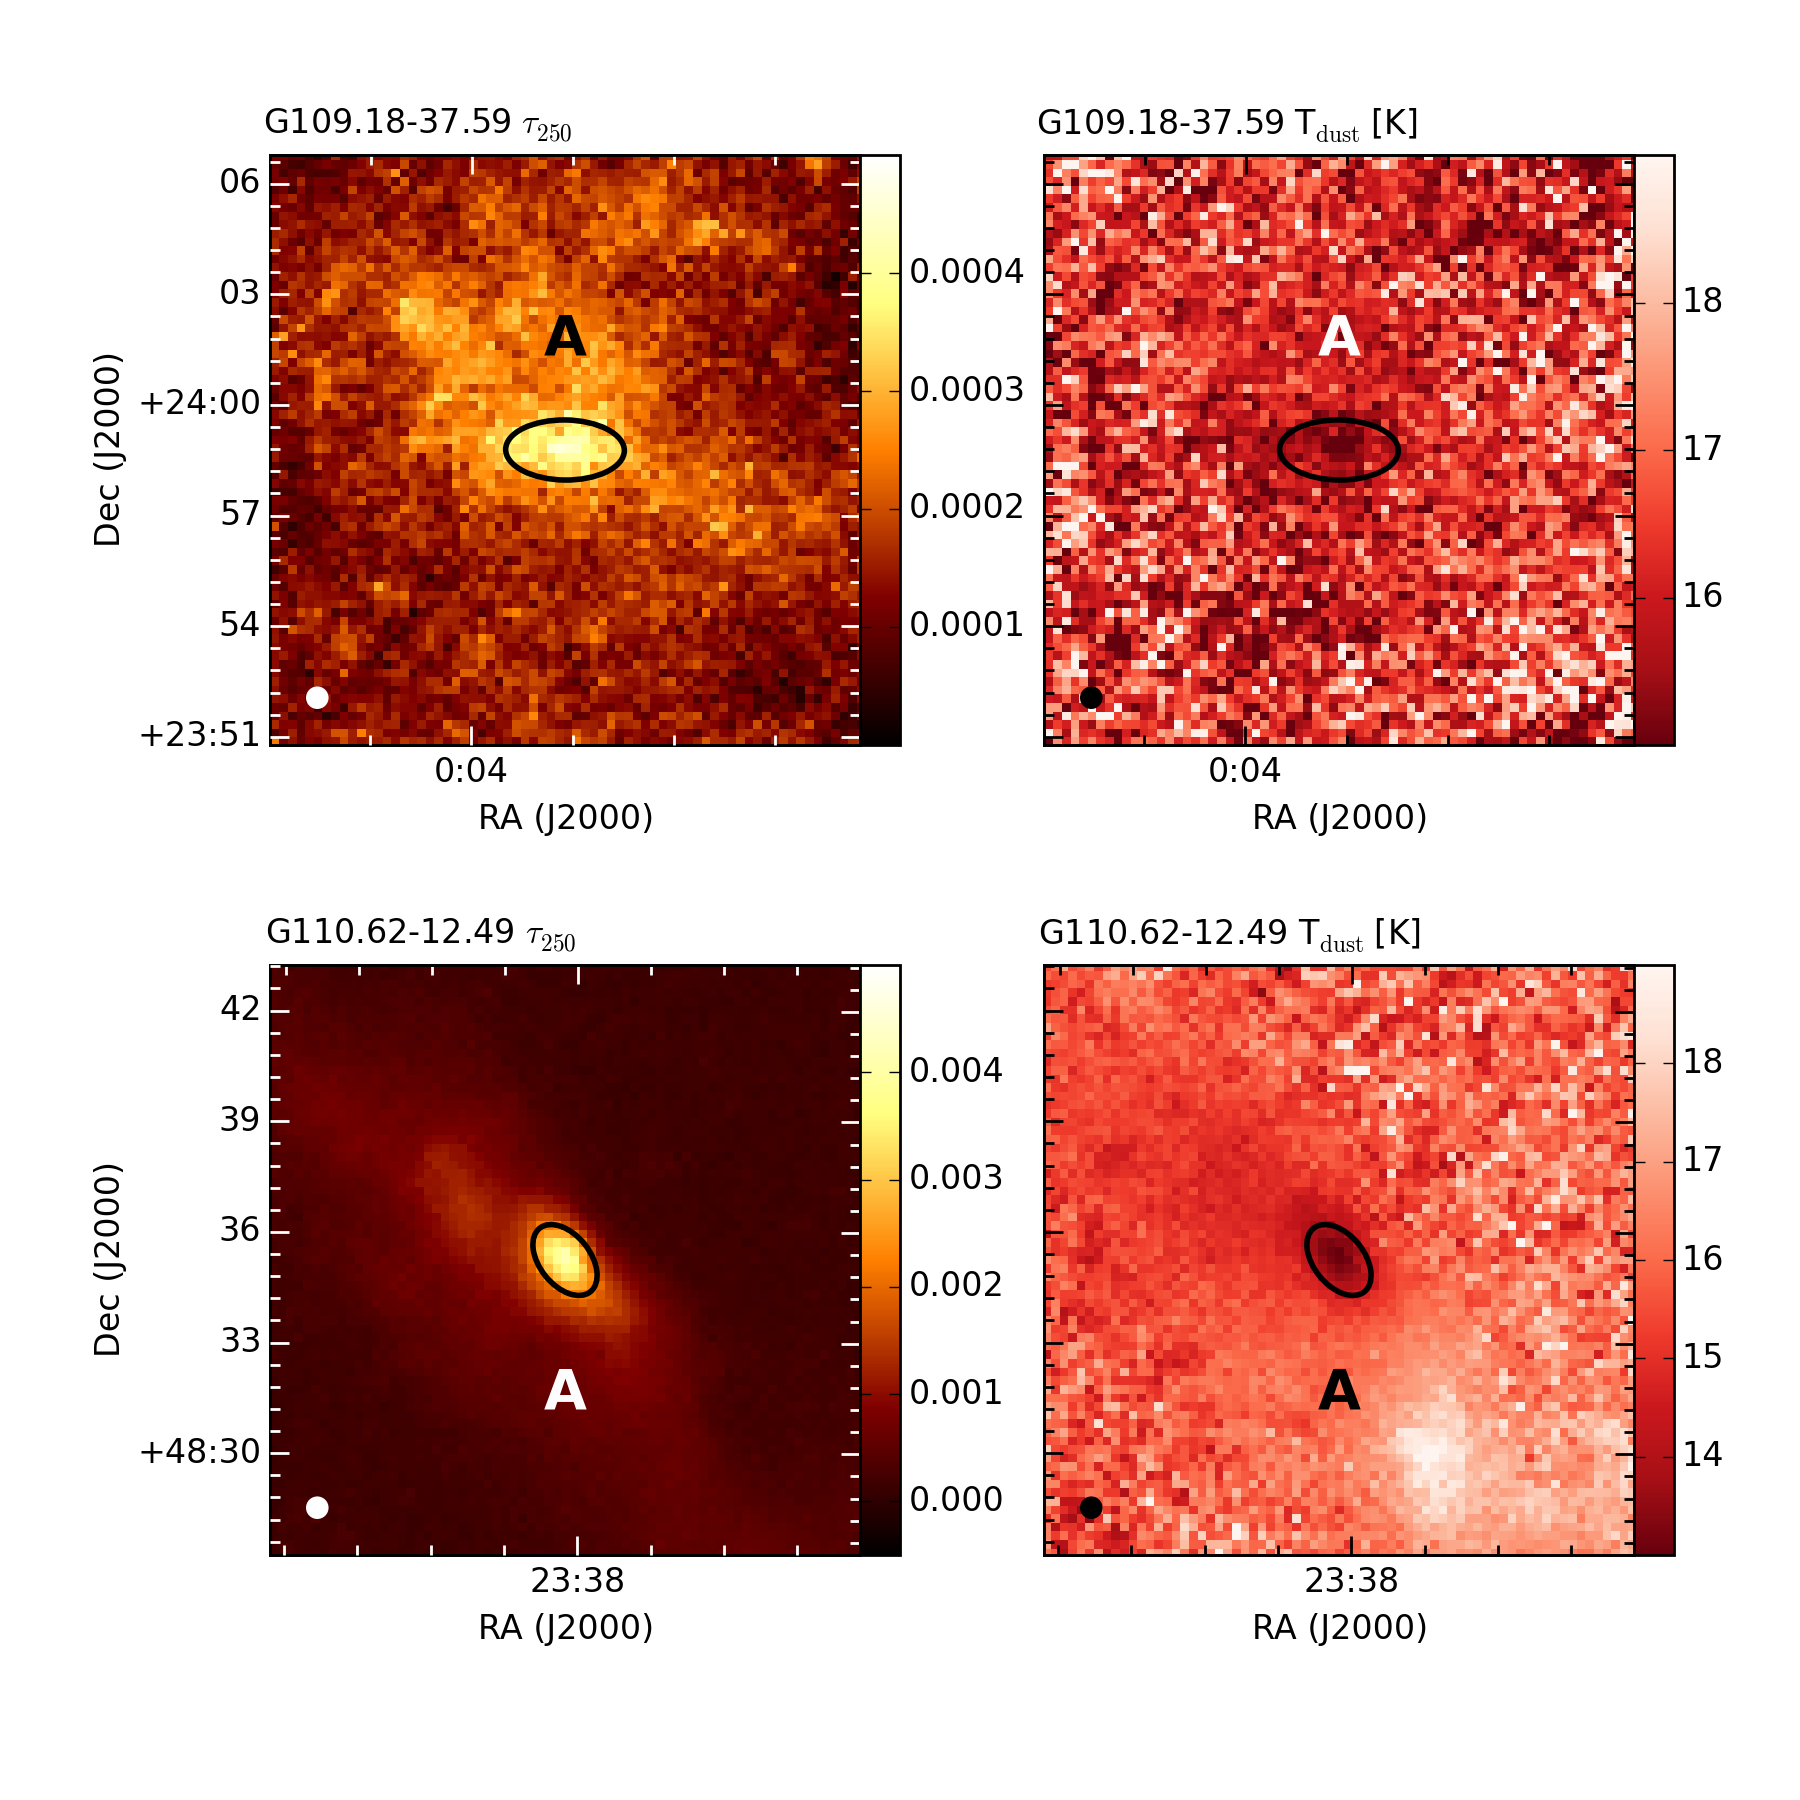
Herschel-based τ250 and Tdust maps of the clumps. Black ellipses mark the 2D Gaussians fitted to the clumps and they are marked with the letter ID of the respective clumps. A white ellipse in the lower left corner shows the beam size of the Herschel map (37″).
This figure is made of several images, please see below:
Current usage metrics show cumulative count of Article Views (full-text article views including HTML views, PDF and ePub downloads, according to the available data) and Abstracts Views on Vision4Press platform.
Data correspond to usage on the plateform after 2015. The current usage metrics is available 48-96 hours after online publication and is updated daily on week days.
Initial download of the metrics may take a while.