Fig. A.2
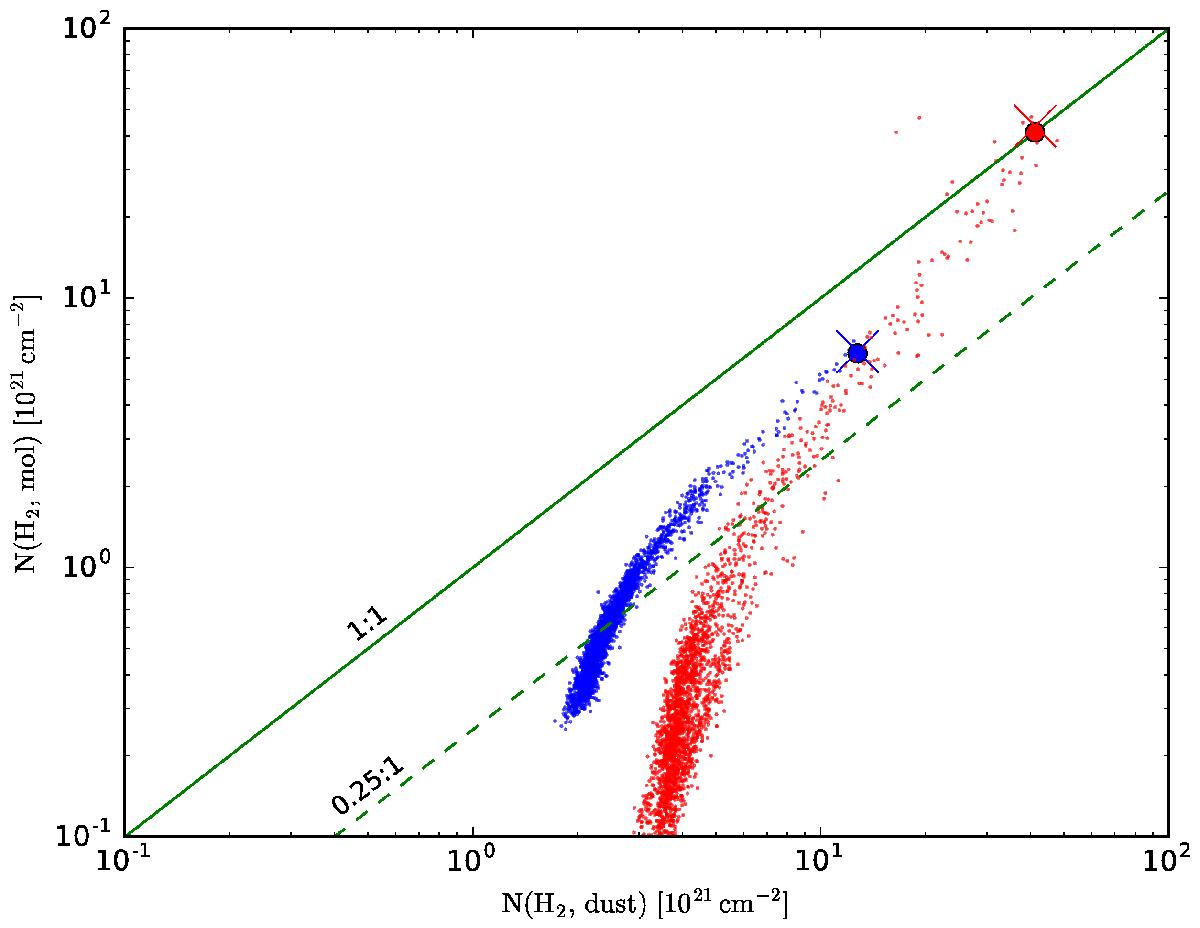
Comparison of column densities derived from radiative transfer models of continuum and line emission. The dots correspond to all the pixels within the central 15′ × 15′ areas of the G26.34+8.65 (blue dots) and G195.74-2.29 (red dots) models. The coloured circles correspond to the positions of the clumps listed in Table 1. The crosses denote the column density estimates obtained assuming Tex = 14 K.
Current usage metrics show cumulative count of Article Views (full-text article views including HTML views, PDF and ePub downloads, according to the available data) and Abstracts Views on Vision4Press platform.
Data correspond to usage on the plateform after 2015. The current usage metrics is available 48-96 hours after online publication and is updated daily on week days.
Initial download of the metrics may take a while.