Fig. A.1
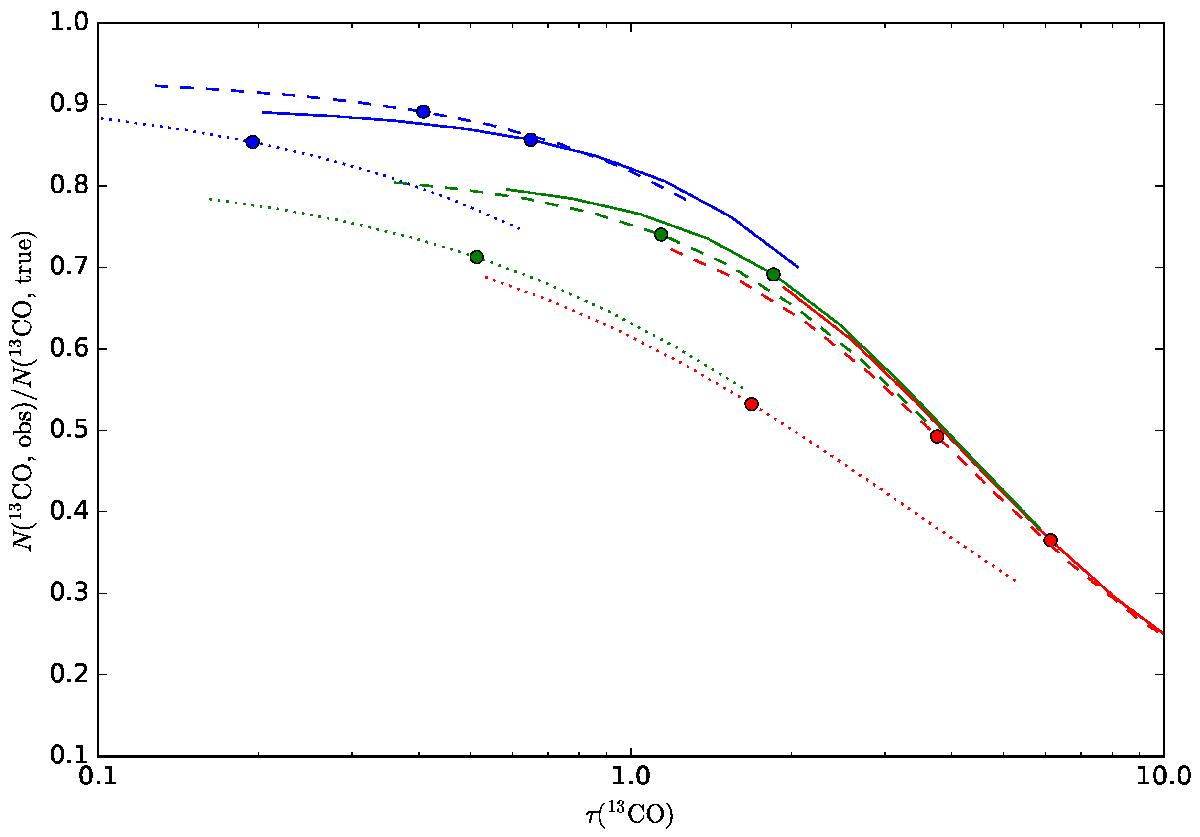
Ratio of the observed and the true 13CO column densities for synthetic observations of Bonnor-Ebert spheres. There are three sets of curves that corresponds to cloud masses of 0.3, 1.0, and 3.0 solar masses (from right to left, colours red, green, and blue, respectively). The solid, dashed, and dotted lines refer to averaging of the data (observed intensity and true values) within 10%, 50%, and 100% of the cloud outer radius. The length of each line corresponds to a variation of the 13CO abundance between 0.3 and 3 times the default value of 10-6.
Current usage metrics show cumulative count of Article Views (full-text article views including HTML views, PDF and ePub downloads, according to the available data) and Abstracts Views on Vision4Press platform.
Data correspond to usage on the plateform after 2015. The current usage metrics is available 48-96 hours after online publication and is updated daily on week days.
Initial download of the metrics may take a while.