Fig. 1
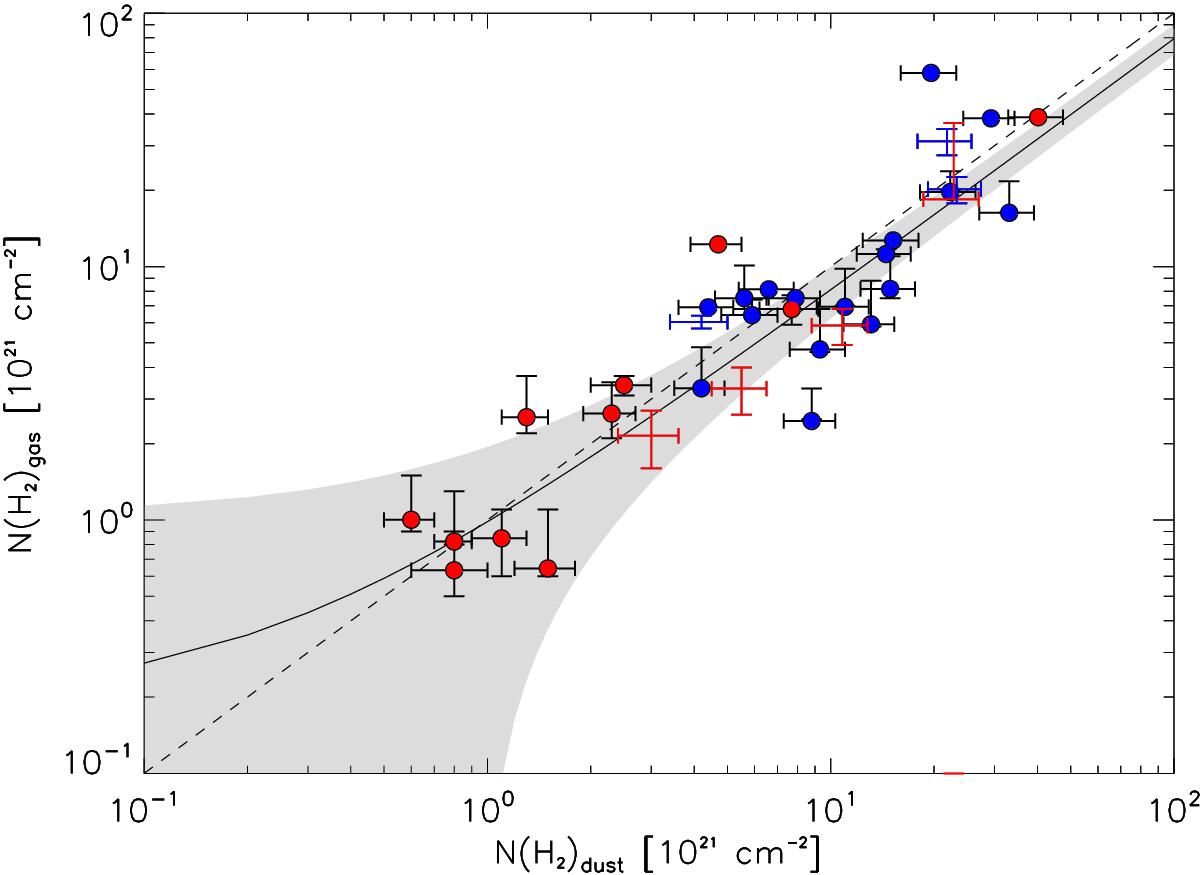
Correlation of N(H2) calculated from dust continuum and from 13CO(1−0) using a 13CO abundance of 10-6. The circles mark the column densities derived from the excitation temperature estimates (where 12CO measurements were available). The vertical error bars show N(H2)gas lower and upper limits calculated using 8.5 and 19.5 K as excitation temperature and the horizontal error bars are from the uncertainty of the τ250 values in the centre of the clumps. The colours indicate the dust colour temperature: blue is below 14 K and red is above 14 K. Where only lower and upper limits of N(H2)gas could be calculated, only error bars are shown with the colour code. The dashed line indicates N(H2)dust = N(H2)gas, the solid line is the linear fit to the plotted values and the shaded area shows the 1σuncertainty range of this fit.
Current usage metrics show cumulative count of Article Views (full-text article views including HTML views, PDF and ePub downloads, according to the available data) and Abstracts Views on Vision4Press platform.
Data correspond to usage on the plateform after 2015. The current usage metrics is available 48-96 hours after online publication and is updated daily on week days.
Initial download of the metrics may take a while.