Free Access
Fig. 8
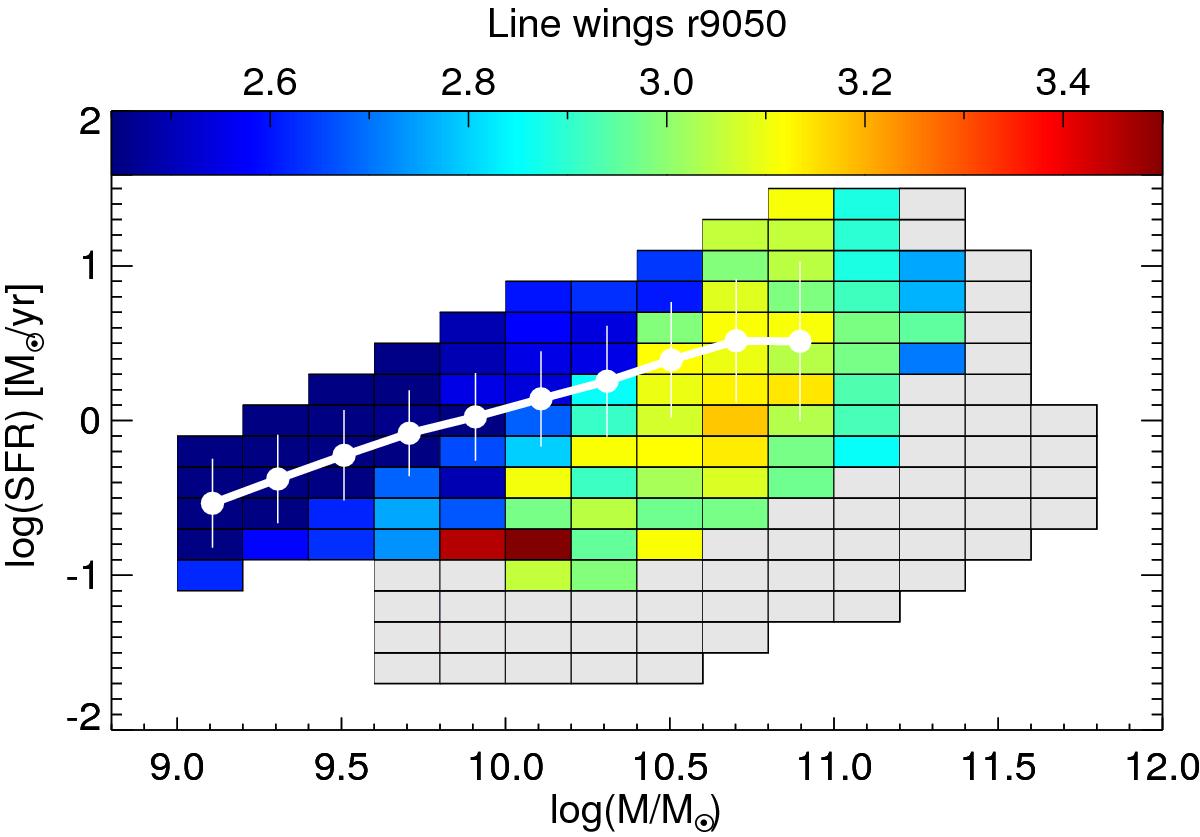
Prominence of the line wings r9050 in the SFR-M⋆ diagram for the total sample. The white line shows the mode and dispersion of the MS. The bins below M⋆ = 1010.5M⊙ have r9050 values consistent with 2.44 within 3σ. The galaxy bins with total emission line S/N< 8 are plotted in gray.
Current usage metrics show cumulative count of Article Views (full-text article views including HTML views, PDF and ePub downloads, according to the available data) and Abstracts Views on Vision4Press platform.
Data correspond to usage on the plateform after 2015. The current usage metrics is available 48-96 hours after online publication and is updated daily on week days.
Initial download of the metrics may take a while.