Fig. 5
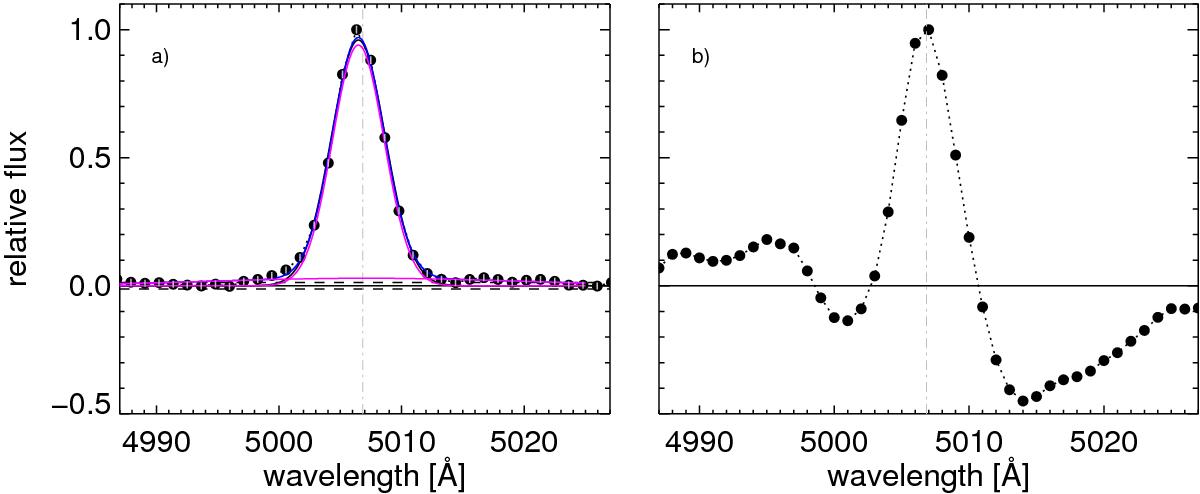
Average [OIII]λ5007 profile of the galaxy subsample with SFR = 100.2M⊙ yr-1 and M⋆ = 1010.5M⊙. In panel a: we show the emission line derived with our method, obtained with the fit and remove of the stellar continuum by pPXF algorithm (see the text for more details). In panel b: we show the emission line for the same SFR and M⋆ galaxies obtained by the continuum-subtracted spectra provided by the SDSS pipeline as shown by Mullaney et al. (2013). Our method is more efficient at modeling and removing the stellar features in the proximity of the [OIII] line. The black symbols are the observed flux. The magenta lines illustrate the two-Gaussian component and the blue curve shows the combined fit. The level of scatter in the residuals of our fit is shown with the horizontal dashed lines. The vertical gray line marks the rest-frame position of the [OIII] line.
Current usage metrics show cumulative count of Article Views (full-text article views including HTML views, PDF and ePub downloads, according to the available data) and Abstracts Views on Vision4Press platform.
Data correspond to usage on the plateform after 2015. The current usage metrics is available 48-96 hours after online publication and is updated daily on week days.
Initial download of the metrics may take a while.