Fig. 4
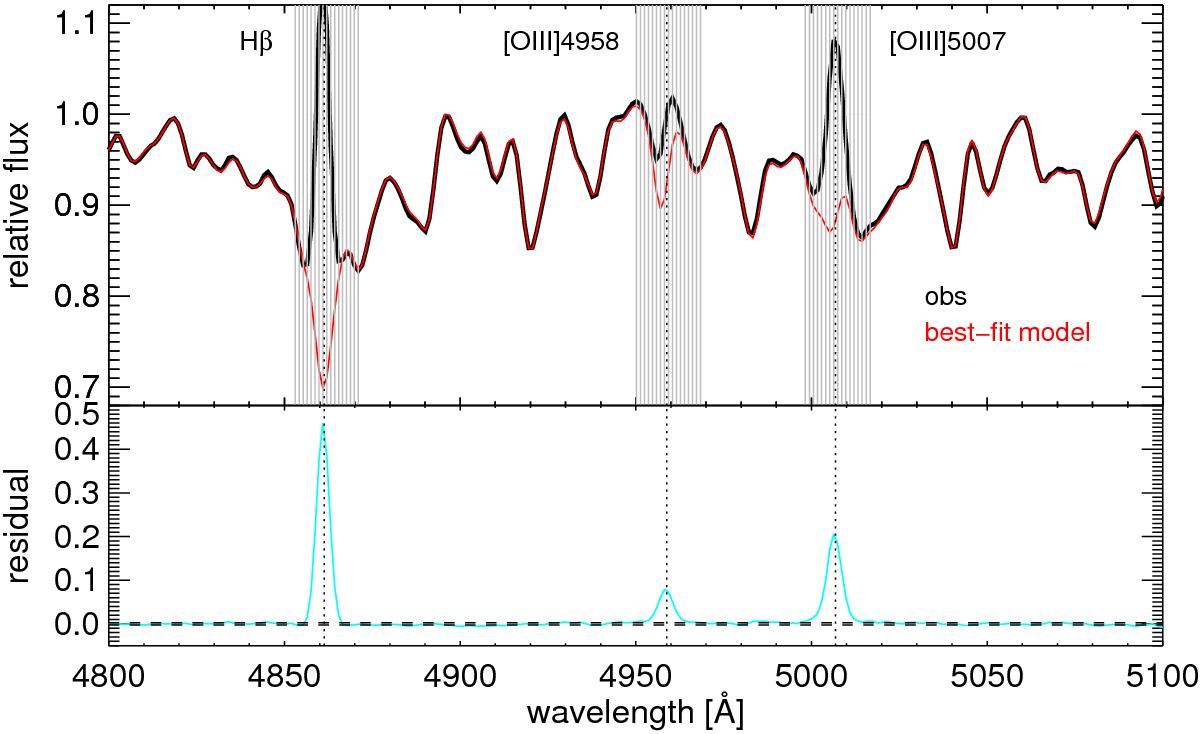
Example of our continuum fit and subtraction performed for the stacked spectrum with SFR = 100.2M⊙ yr-1 and M⋆ = 1010.5M⊙. The top panel shows the observed stacked spectrum (black line) and our best-fit stellar continuum model (red line). The light-gray-shaded regions indicate the wavelength range where the Hβ, [OIII]λ4959 and [OIII]λ5007 emission lines are located. The bottom panel shows the residual spectrum (cyan line) and the level of fluctuations in the fit residuals (dashed line).
Current usage metrics show cumulative count of Article Views (full-text article views including HTML views, PDF and ePub downloads, according to the available data) and Abstracts Views on Vision4Press platform.
Data correspond to usage on the plateform after 2015. The current usage metrics is available 48-96 hours after online publication and is updated daily on week days.
Initial download of the metrics may take a while.