Fig. 2
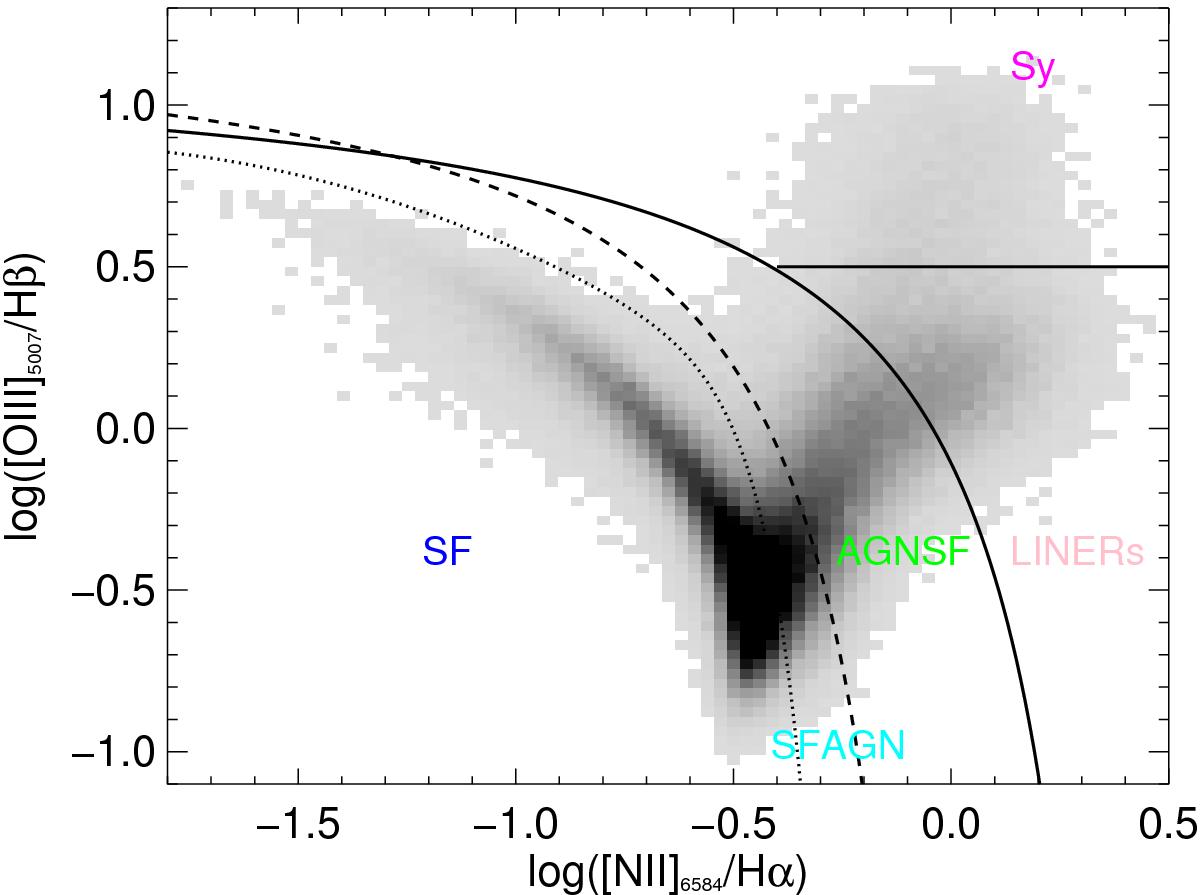
Distribution of the galaxies in our sample in the BPT line-ratio diagram. The solid curve is the theoretical demarcation of Kewley et al. (2001) , that separates star-forming galaxies and composites from AGN. The dashed (Kauffmann et al. 2003a ) and dotted Stasinska et al. (2006) curves indicate the empirical division between composite SF-AGN and AGN-SF and the pure star-forming galaxies, respectively (see text for more details). The horizontal line at log ([OIII]/Hβ) = 0.5 is the demarcation criteria between TYPE 2 (or Seyfert, Sy) and LINERs galaxies showed in Kewley et al. (2006).
Current usage metrics show cumulative count of Article Views (full-text article views including HTML views, PDF and ePub downloads, according to the available data) and Abstracts Views on Vision4Press platform.
Data correspond to usage on the plateform after 2015. The current usage metrics is available 48-96 hours after online publication and is updated daily on week days.
Initial download of the metrics may take a while.