Fig. 17
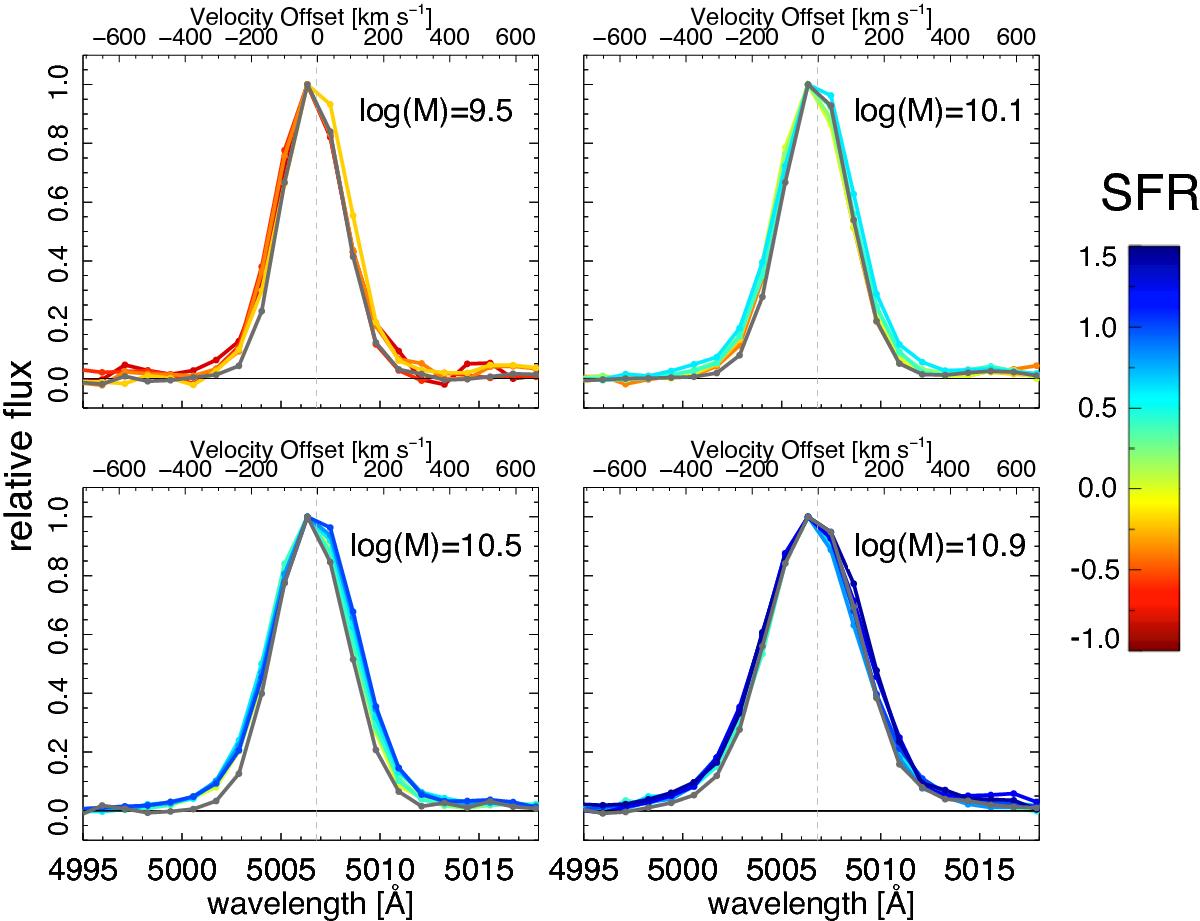
Comparison in four different stellar mass bins of the observed [OIII] line profile of pure SF (gray curves) and SF-AGN galaxies (color curves) in the HII sample, classified according to the BPT classification of Stasinska et al. (2006). The line profile of the pure SF galaxies does not change as a function of the SF level. For this reason, in each mass bin, we only show a single curve concerning one level of SFR. The line profile of the SF-AGN galaxies tends to increase in width at increasing SFR as indicated by the several curves color-coded as a function of the SFR.
Current usage metrics show cumulative count of Article Views (full-text article views including HTML views, PDF and ePub downloads, according to the available data) and Abstracts Views on Vision4Press platform.
Data correspond to usage on the plateform after 2015. The current usage metrics is available 48-96 hours after online publication and is updated daily on week days.
Initial download of the metrics may take a while.