Fig. 13
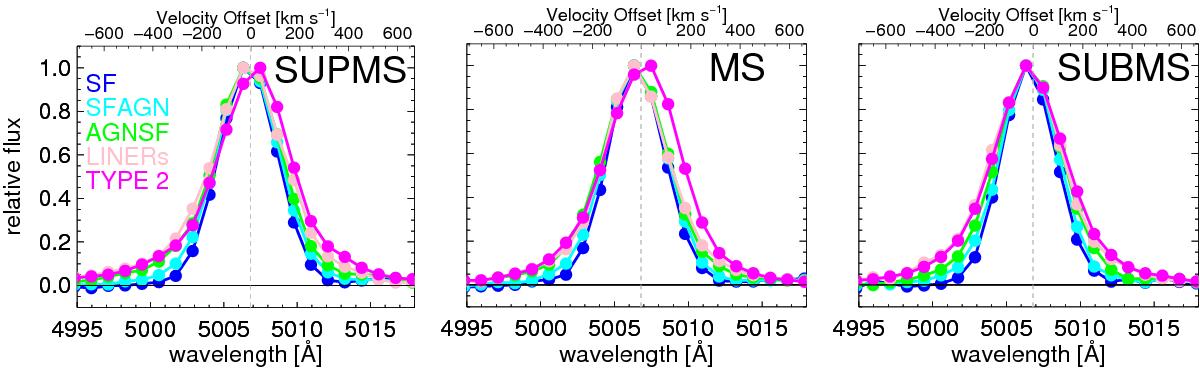
Variation of the observed [OIII] emission line profile as a function of the SF and AGN contribution for galaxies located in different SFR bins. In the left, middle, and right panels we show the galaxy bins located above (SUPMS), inside (MS) and below (SUBMS) the MS, respectively, with ΔSFR = 0.4, 0.0 and − 0.4 dex. The galaxy bins shown have M⋆ = 1010.5M⊙. The [OIII] emission line appears at any M⋆ and SFR.
Current usage metrics show cumulative count of Article Views (full-text article views including HTML views, PDF and ePub downloads, according to the available data) and Abstracts Views on Vision4Press platform.
Data correspond to usage on the plateform after 2015. The current usage metrics is available 48-96 hours after online publication and is updated daily on week days.
Initial download of the metrics may take a while.