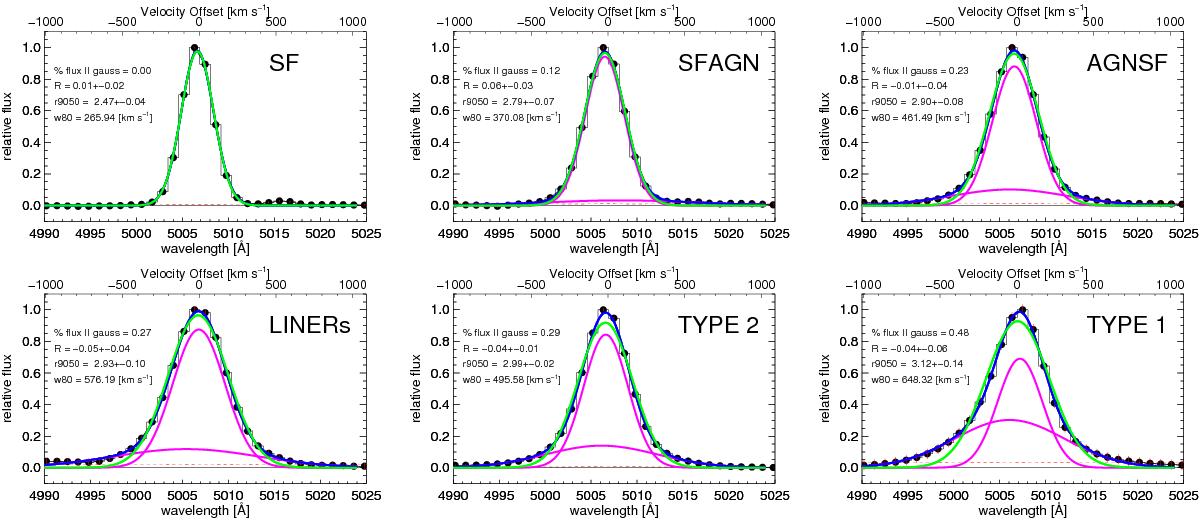
Fig. 11

Emission-line profile fits to composite spectra in different classes of photoionization processes: SF, SF−AGN, AGN−SF, LINERs, TYPE 2 and TYPE 1. The black symbols are the observed flux. The flux errors, in each point, are shown in red. The green line shows the single-Gaussian fit. The magenta line illustrates the two-Gaussian component and the blue curve shows the combined fit. The level of scatter in the residuals of our fit is shown with the horizontal dashed red lines. The significance of a second broad and blue-shifted component (magenta curves) is remarkably increasing with the increase of the AGN contribution. In each panel we show the derived values of flux enclosed in the second broader Gaussian component, asymmetry R, prominence of the line wings r9050 and w80.
Current usage metrics show cumulative count of Article Views (full-text article views including HTML views, PDF and ePub downloads, according to the available data) and Abstracts Views on Vision4Press platform.
Data correspond to usage on the plateform after 2015. The current usage metrics is available 48-96 hours after online publication and is updated daily on week days.
Initial download of the metrics may take a while.


