Fig. 10
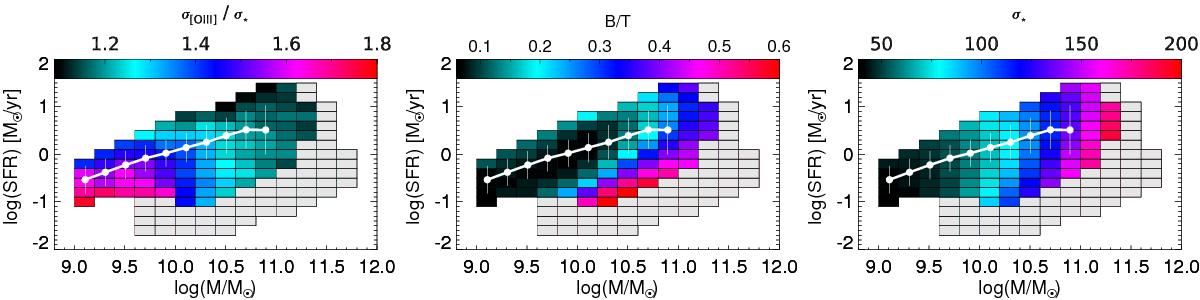
Left panel: σ[ OIII ]/σ⋆ in the SFR-M⋆ plane. At high stellar mass, the gas kinematics follows the velocity dispersion of the stellar component. Central panel: B/T median values in the SFR-M⋆ diagram. The bulge-disk decomposition is taken from the Simard et al. (2011) catalog. We use the values calculated with the r filter. Right panel: σ⋆ distribution in the SFR-M⋆ plane. At low stellar masses the σ⋆ is below to the instrumental resolution. In all panels, the white line shows the mode and dispersion of the MS.
Current usage metrics show cumulative count of Article Views (full-text article views including HTML views, PDF and ePub downloads, according to the available data) and Abstracts Views on Vision4Press platform.
Data correspond to usage on the plateform after 2015. The current usage metrics is available 48-96 hours after online publication and is updated daily on week days.
Initial download of the metrics may take a while.