Free Access
Fig. 2
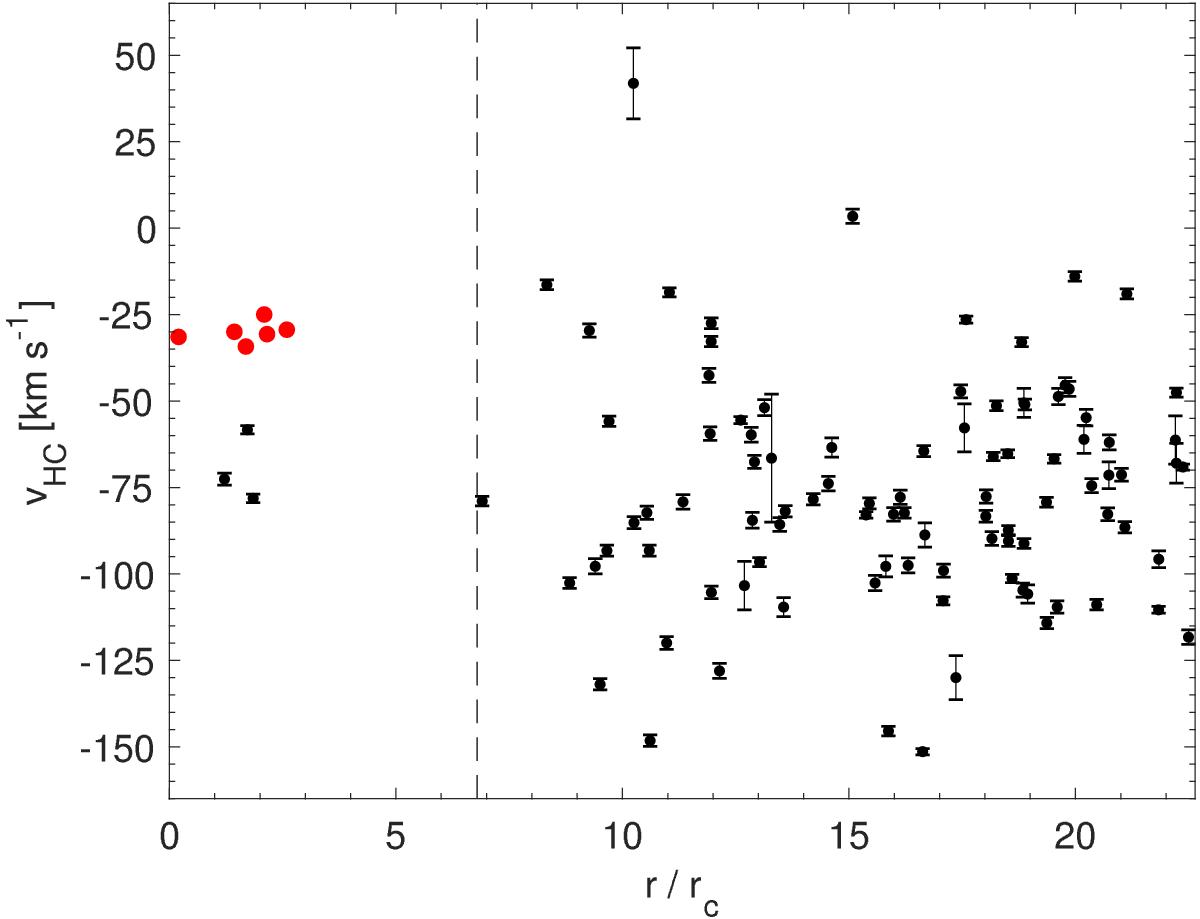
Radial distribution of radial velocities in the inner sample, in units of the cluster’s core-radius of 26.5″ (Froebrich et al. 2008). The vertical line illustrates the “full extent” of the cluster of 3′ as measured by Minniti et al. (2017). Red circles indicate the member candidates.
Current usage metrics show cumulative count of Article Views (full-text article views including HTML views, PDF and ePub downloads, according to the available data) and Abstracts Views on Vision4Press platform.
Data correspond to usage on the plateform after 2015. The current usage metrics is available 48-96 hours after online publication and is updated daily on week days.
Initial download of the metrics may take a while.