| Issue |
A&A
Volume 605, September 2017
|
|
|---|---|---|
| Article Number | L8 | |
| Number of page(s) | 4 | |
| Section | Letters | |
| DOI | https://doi.org/10.1051/0004-6361/201731695 | |
| Published online | 15 September 2017 | |
Accurate spectroscopic redshift of the multiply lensed quasar PSOJ0147 from the Pan-STARRS survey
Subaru Telescope, National Astronomical Observatory of Japan, 650 North Aohoku Place, Hilo, HI 96720, USA
e-mail: This email address is being protected from spambots. You need JavaScript enabled to view it.
Received: 2 August 2017
Accepted: 14 August 2017
Abstract
Context. The gravitational lensing time delay method provides a one-step determination of the Hubble constant (H0) with an uncertainty level on par with the cosmic distance ladder method. However, to further investigate the nature of the dark energy, a H0 estimate down to 1% level is greatly needed. This requires dozens of strongly lensed quasars that are yet to be delivered by ongoing and forthcoming all-sky surveys.
Aims. In this work we aim to determine the spectroscopic redshift of PSOJ0147, the first strongly lensed quasar candidate found in the Pan-STARRS survey. The main goal of our work is to derive an accurate redshift estimate of the background quasar for cosmography.
Methods. To obtain timely spectroscopically follow-up, we took advantage of the fast-track service programme that is carried out by the Nordic Optical Telescope. Using a grism covering 3200−9600 Å, we identified prominent emission line features, such as Lyα, N V, O I, C II, Si IV, C IV, and [C III] in the spectra of the background quasar of the PSOJ0147 lens system. This enables us to determine accurately the redshift of the background quasar.
Results. The spectrum of the background quasar exhibits prominent absorption features bluewards of the strong emission lines, such as Lyα, N V, and C IV. These blue absorption lines indicate that the background source is a broad absorption line (BAL) quasar. Unfortunately, the BAL features hamper an accurate determination of redshift using the above-mentioned strong emission lines. Nevertheless, we are able to determine a redshift of 2.341 ± 0.001 from three of the four lensed quasar images with the clean forbidden line [C III]. In addition, we also derive a maximum outflow velocity of ~9800 km s-1 with the broad absorption features bluewards of the C IV emission line. This value of maximum outflow velocity is in good agreement with other BAL quasars.
Key words: gravitational lensing: strong / quasars: general / cosmology: observations
© ESO, 2017
1. Introduction
In the era of precision cosmology, determining H0 to 1% level locally, and comparing the local measurements with those from the cosmic microwave background (CMB) can provide stringent constraints on the nature of dark energy, the physics of neutrinos, and the spatial curvature of the Universe. Using a distance ladder method, the Supernovae, H0, for the Equation of State of Dark energy (SH0ES) team has measured H0 to 2.4% (Riess et al. 2016), which is in tension with (at the 3.4σ level) the H0 measurement from the Planck CMB results. While it is tempting to claim such tension is due to systematics in the Planck measurements or a sign of new physics, it is important to obtain independent local H0 measurements with accuracy and precision comparable to those of the SH0ES results.
One alternative is via gravitational lensing time delay. With this method, for a strongly lensed, multiply imaged source, the photons from each of the images travel through different light paths (geodesics). Since the differences in the light travel times (or time delays) only depend on the space-time curvature, we can thus measure H0. Refsdal (1964) first suggested using supernovae to measure the time delay. However, because of the lack of all-sky transient surveys, time delay measurements have been carried out with quasars instead. For example, the latest study from H0LiCOW (Suyu et al. 2017) demonstrate that even with time delay measurements with merely three multiply lensed quasars, one can determine a H0 as accurate and precise as 3.8% (Bonvin et al. 2017). This is only possible because the effects of mass along the line of sight are also constrained with extensive spectroscopic observations (Rusu et al. 2017), enabling the H0LiCOW team to carry out a detailed account of the systematics, including the mass-sheet degeneracy.
The time delay method provides an independent and consistent local measurement of H0 similar to the cosmic distance ladder method, and results from both of these methods are in tension with the CMB results from the Planck satellite. However, we need to measure H0 down to the 1% level to investigate the nature of the dark energy. Unfortunately, currently the H0LiCOW team only has a handful of good multiply lensed systems, hence an increase in the number of the multiply lensed quasars is in great demand. In this regard, Berghea et al. (2017) have recently discovered a new quadruply lensed quasar candidate, PSOJ0147, from the Pan-STARRS survey. As three out of four lensed quasar images are rather bright, this new Pan-STARRS lensed quasar candidate provides a potentially interesting case for accurate time delay measurements. This is especially the case in the context of the high-cadence, high signal-to-noise ratio (S/N) monitoring method recently established by Courbin et al. (2017). However, this is not the case for the counter image. This faintest image remains out of reach of current lens monitoring telescopes.
In this paper we present spectroscopic follow-up of this new candidate, with the aim to confirm its lensing nature, to provide an accurate spectroscopic redshift estimate, and to form a firm basis for cosmography.
2. Observations and data reduction
When Berghea et al. (2017) first reported the discovery of PSOJ0147, it was not visible for prompt spectroscopic follow-up. The four lensed quasar images are rather bright, with brightnesses of i = 15.40−16.21 mag for the three brighter images and i = 17.74 for the faintest counter image. In this regard, we can easily obtain spectra with decent spectral S/N of the three brighter images. For example, the required spectral S/N can be reached with a 2 m class telescope with an exposure time of merely half an hour.
To obtain the spectra in a timely manner, we thus made use of the fast-track service programme with the 2.5 m Nordic Optical Telescope at La Palma observatory and with its Andalucia Faint Object Spectrograph and Camera (ALFOSC).
To confirm the lensing nature, we only needed to observe a subset of the four lensed quasar images. We thus used a 1.0 arcsec slit to cover the three brighter lensed quasar images (see Fig. 1). We elaborately chose a grism with a spectral range from 3200 to 9600 Å. This grism enabled us to cover a wide wavelength across the optical spectrum to identify as many quasar emission line features as possible. Given a photometric redshift estimate of z = 2.6−2.8, we expected to identify various prominent emission line features, such as Lyαλλ 1215.24 Å, N V λλ 1240.81 Å, C IV λλ 1549.48 Å, and [C III] λλ 1908.734 Å. This enables us to corroborate the Berghea et al. determination of the redshift of the quasar. The observations were carried out on July 22, 2017 with a median seeing of 1.3 arcsec.
Since we needed to align our slit to a fixed position angle, we employed an atmospheric dispersion corrector during the spectroscopic observation to avoid differential atmospheric refraction. To get rid of bad pixels on the CCD and to remove cosmic ray features in the spectra, the spectroscopic observation was dithered with an A-B-B-A sequence with a dithering size of 1 arcsec. At each dithering position we took a 300-s exposure for each of the spectra. This resulted in a total integration time of 20 min. In addition to the target, we also obtained observations of the spectroscopic standard star BD+28d4211 for flux calibration.
The data reduction was carried out in a standard manner via routines in IRAF1. The data reduction included steps of bias subtraction, flat fielding, wavelength calibration using a Thorium-Argon lamp, and flux calibration using the spectroscopic standard star BD+28d4211.
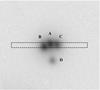 |
Fig. 1 Set-up of our ALFOSC spectroscopic observation. The four lensed quasar images are indicated from A to D, starting from the brightest image A with i = 15.40 mag. The dashed rectangle shows the 1.0 arcsec slit. With a fixed slit position angle of 90 degrees, we can obtain spectra for the three brighter lensed quasar images in one shot. The underlaying image is from Pan-STARRS i-band observation (Chambers et al. 2016), with a size of 10 × 10 arcsec2 with north up and east to the left. |
3. Results
After data reduction, wavelength and flux calibration, we identify prominent emission lines, including Lyα, N V, Si IV, C IV, and [C III] in the spectra of all three lensed quasar images. We also see traces of O I and C II. The spectra from images A, B, and C, and the above-mentioned emission lines are indicated in Fig. 2. Besides the emission lines, there are broad absorption regions bluewards of these emission lines in the spectra of all three lensed quasar images. These broad absorptions suggest that this quasar belongs to the broad absorption line (BAL) category.
The BALs originate from gaseous materials along our line of sight. Given the proximity of these BALs to the quasar emission lines in all of the spectra of the lensed quasar images, these BALs are physically associated with the background quasar and stem from the outflow from the central AGN.
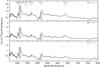 |
Fig. 2 Spectra of images A (upper panel), B (middle panel), and C (lower panel) from ALFOSC mounted on the Nordic Optical Telescope. Prominent emission lines, such as Lyαλλ 1215.24, N V λλ 1240.81, Si IV λλ 1397.61, C IV λλ 1549.48, and [C III] λλ 1908.734 are indicated with black labels, assuming a redshift of 2.341. In addition, we also find traces of O I λλ 1305.53 and C II λλ 1335.31. Besides emission lines, the spectra also exhibit complicated absorption features blanketing the emission lines. This is especially the case in regions bluewards of Lyα, N V, Si IV, and C V. These broad absorption lines indicate that the background quasar of the PSOJ0147 lens system belongs to the BAL category. |
Such intrinsic BALs provide important probes to the kinematics, physical conditions, and elemental abundances in the gases surrounding AGNs, but these BAL features hamper an accurate redshift estimate of the background quasar. In this regard, we thus exclude the strong Lyα, N V, and C IV emission lines and only use the [C III] line for redshift estimate. This is because [C III] is a semi-forbidden transition, where no absorption is expected. The [C III] emission line is therefore less susceptible to outflow and much cleaner to serve the purpose of an accurate redshift estimate. The Lyα, N V, C IV, and other fainter emission lines can nevertheless provide a sanity check and constrain the redshift estimate from [C III].
Gaussian centroids of [C III] emission line in images A−C.
Gaussian centroids of BALs bluewards of C IV in images A−C.
To measure the redshift, we used the splot task in IRAF and fit a Gaussian function to the [C III] feature in each of the images A, B, and C. We used the mean of the Gaussian centroids from each of the images to determine the redshift and the standard deviation to estimate the redshift uncertainty. We thus obtain a redshift of z = 2.341 ± 0.001. The values of the Gaussian centroids from each of the images A, B, and C are shown in Table 1.
Given the redshift of the background quasar, we can also estimate the maximum outflow velocity from the BALs. Here we use the BALs bluewards of C IV to estimate the outflow velocity. The BALs show complex feature, nevertheless, for our propose of determining the maximum outflow velocity, we only needed to use the bluest BAL feature in the vicinity of C IV. We thus only used the strong absorption line close to 5000 Å at the observer’s frame. We fit a Gaussian profile to each of the spectra of images A, B, and C, and used the Gaussian centroids to obtain an maximum outflow velocity of 9800 km s-1. The values of the Gaussian centroids from each of the images A, B, and C are shown in Table 2.
4. Discussions
An accurate redshift estimate of the background source is essential to time delay studies and pivotal to strong lens systems for cosmography. Hence, it is important to understand the differences between our spectroscopic follow-up results and those from a previous study by Rubin et al. (2017). In Rubin et al. (2017), they have obtained a higher redshift estimate. Here we list two possible causes for such discrepancies in the redshift estimate from Rubin et al. (2017):
-
1.
Narrow wavelength coverage. While the Keck Cosmic WebImager provides a spectral resolution ofR ~ 5000, the spectral coverage in Rubin et al. (2017) is rather narrow, from 3500 to 5500 Å. In this regard, Rubin et al. (2017) have only identified Lyα, Si IV, and C IV in their spectra and have also pointed out that observations at longer wavelengths are needed to better constrain the redshift of the background quasar. Our spectra, on the other hand, cover a wider spectral range from 3200 to 9600 Å. Our spectra are thus suffice for a more accurate spectroscopic redshift estimate.
-
2.
BAL contaminations. As has been pointed out by Rubin et al. (2017), the background quasar of PSOJ0147 belongs to the BAL category, showing complicated absorption features blanketing the broad emission lines of Lyα, Si IV, and C IV. In this regard, BALs hamper accurate redshift estimates if these strong emission lines are used for spectroscopic redshift determination. While Rubin et al. (2017) have excluded spectral range bluer than λrest = 1250 Å, i.e. the Lyα and N V regions, they have nevertheless included C IV for redshift estimate. The C IV emission line is the brightest after Lyα and N V, and is still heavily blanketed by BALs, thus hampering accurate redshift determination as well. Our redshift estimate, on the other hand, follows the approach of Lin et al. (2017) and only relies on the [C III] emission line. As [C III] is a semi-forbidden line, it is less susceptible to BALs and is one of the cleanest emission lines for redshift determination.
As a comparison, we also performed a test of the redshift estimate by adopting the same spectral range to our spectra as that of Rubin et al. (2017), and we used this narrower spectral range to investigate the redshift estimate from our data. In this spectral range, the strongest emission line feature is the C IV emission line. We thus calculated a redshift with the peak of the C IV emission line in our data, which is at 5215 A in the observer’s frame. We then obtained a redshift estimate of z = 2.37, which is in agreement with the redshift estimate from Rubin et al. (2017). This suggests that the discrepancy between our redshift measurment and that of Rubin et al. (2017) is actually due to the spectral range.
In addition to the strong lensing effect, the background quasar may also be subject to microlensing effects. As microlensing has different effects on the continuum than on the emission lines and absorption lines, one can thus use the ratio spectra to unveil the microlensing effects. However, owing to the poor seeing condition and blending of our spectra, we were not able to further investigate the microlensing effects with the current data.
5. Conclusions
PSOJ0147 is a recently discovered and first quadruply lensed quasar candidate from the Pan-STARRS survey public data. In this work, we obtained timely spectroscopic follow-up of PSOJ0147 using the ALFOSC on board the Nordic Optical Telescope. Our results can be summarized as follows:
- 1.
We provide a more accurate redshift estimate of the background lensed quasar. Given the BAL nature of the background quasar, it is difficult to determine the redshift of the background quasar using, e.g. Lyα, N V, Si IV, and C IV emission lines. Unfortunately, the Rubin et al. (2017) study has only covered a narrow wavelength (i.e. up to C IV at the observer’s frame), which hampered an accurate redshift determination. In this work, we present a much wider spectral coverage. In addition, our redshift estimate is only based on the semi-forbidden emission line [C III], which is less susceptible and much cleaner for the purpose of redshift determination. We estimate the redshift of the background quasar to be 2.341 ± 0.001, providing a firm base to use the PSOJ0147 lens system for cosmography studies.
- 2.
We determine the maximum outflow velocity of the background quasar. The BAL quasars are instrumental in probing gases around AGNs, especially the gaseous kinematics, physical conditions, and elemental abundances. Using the BALs bluewards of the C IV emission line, we are able to derive an maximum outflow velocity of ~9800 km s-1 for the background quasar of PSOJ0147. Further studies of the surrounding gases will require spectroscopic observations with higher resolutions.
The fact that the background quasar of PSOJ0147 belongs to the BAL category is an important discovery, especially in two aspects. First of all, BAL quasars exhibit more variability than other quasars, hence BAL quasars are ideal targets for time delay measurements. Secondly, microlensing effects in the BAL part of the quasar spectra can provide insights into the BAL structure.
Besides accurate redshift, time delay measurements are another essential ingredient in the use of multiply lensed quasars for cosmography. While previous works rely on decade-long photometric monitoring campaigns to obtain precise time delay measurements, it has been shown that high-cadence, high S/N photometric follow-up can drastically reduce the required time span of photometric monitoring down to a few months (Courbin et al. 2017). With this high-cadence approach, we can even beat down the microlensing effect, further reducing the systematics in time delay analyses. The PSOJ0147 lens system is suitable for such a short time-span approach thanks to its bright nature. With a magnitude of 15.4−16.2 in the i-band for the three brighter images, we can reach S/N> 1000 within a few minutes using 2 m class telescopes, making it another ideal lens system for gravitational lensing time delay and cosmography. The faintest counter image, however, remains out of reach of current lens monitoring telescopes.
IRAF is distributed by the National Optical Astronomy Observatory, which is operated by the Association of Universities for Research in Astronomy (AURA) under a cooperative agreement with the National Science Foundation.
Acknowledgments
We are indebted to the referee, whose insightful comments greatly improved this manuscript. Based on observations made with the Nordic Optical Telescope, operated by the Nordic Optical Telescope Scientific Association at the Observatorio del Roque de los Muchachos, La Palma, Spain, of the Instituto de Astrofisica de Canarias. The data presented here were obtained with ALFOSC, which is provided by the Instituto de Astrofisica de Andalucia (IAA) under a joint agreement with the University of Copenhagen and NOTSA.
References
- Berghea, C. T., Nelson, G. J., Rusu, C. E., Keeton, C. R., & Dudik, R. P. 2017, ApJ, 844, 90 [NASA ADS] [CrossRef] [Google Scholar]
- Bonvin, V., Courbin, F., Suyu, S. H., et al. 2017, MNRAS, 465, 4914 [NASA ADS] [CrossRef] [Google Scholar]
- Chambers, K. C., Magnier, E. A., Metcalfe, N., et al. 2016, ArXiv e-print [arXiv:1612.05560] [Google Scholar]
- Courbin, F., Bonvin, V., Buckley-Geer, E., et al. 2017, A&A, submitted [arXiv:1706.09424] [Google Scholar]
- Lin, H., Buckley-Geer, E., Agnello, A., et al. 2017, ApJ, 838, L15 [NASA ADS] [CrossRef] [Google Scholar]
- Refsdal, S. 1964, MNRAS, 128, 307 [NASA ADS] [CrossRef] [Google Scholar]
- Riess, A. G., Macri, L. M., Hoffmann, S. L., et al. 2016, ApJ, 826, 56 [NASA ADS] [CrossRef] [Google Scholar]
- Rubin, K. H. R., O’Meara, J. M., Cooksey, K. L., et al. 2017, ApJ, submitted [arXiv:1707.05873] [Google Scholar]
- Rusu, C. E., Fassnacht, C. D., Sluse, D., et al. 2017, MNRAS, 467, 4220 [NASA ADS] [CrossRef] [Google Scholar]
- Suyu, S. H., Bonvin, V., Courbin, F., et al. 2017, MNRAS, 468, 2590 [Google Scholar]
All Tables
All Figures
|
Fig. 1 Set-up of our ALFOSC spectroscopic observation. The four lensed quasar images are indicated from A to D, starting from the brightest image A with i = 15.40 mag. The dashed rectangle shows the 1.0 arcsec slit. With a fixed slit position angle of 90 degrees, we can obtain spectra for the three brighter lensed quasar images in one shot. The underlaying image is from Pan-STARRS i-band observation (Chambers et al. 2016), with a size of 10 × 10 arcsec2 with north up and east to the left. |
| In the text | |
|
Fig. 2 Spectra of images A (upper panel), B (middle panel), and C (lower panel) from ALFOSC mounted on the Nordic Optical Telescope. Prominent emission lines, such as Lyαλλ 1215.24, N V λλ 1240.81, Si IV λλ 1397.61, C IV λλ 1549.48, and [C III] λλ 1908.734 are indicated with black labels, assuming a redshift of 2.341. In addition, we also find traces of O I λλ 1305.53 and C II λλ 1335.31. Besides emission lines, the spectra also exhibit complicated absorption features blanketing the emission lines. This is especially the case in regions bluewards of Lyα, N V, Si IV, and C V. These broad absorption lines indicate that the background quasar of the PSOJ0147 lens system belongs to the BAL category. |
| In the text | |
Current usage metrics show cumulative count of Article Views (full-text article views including HTML views, PDF and ePub downloads, according to the available data) and Abstracts Views on Vision4Press platform.
Data correspond to usage on the plateform after 2015. The current usage metrics is available 48-96 hours after online publication and is updated daily on week days.
Initial download of the metrics may take a while.