Fig. 3
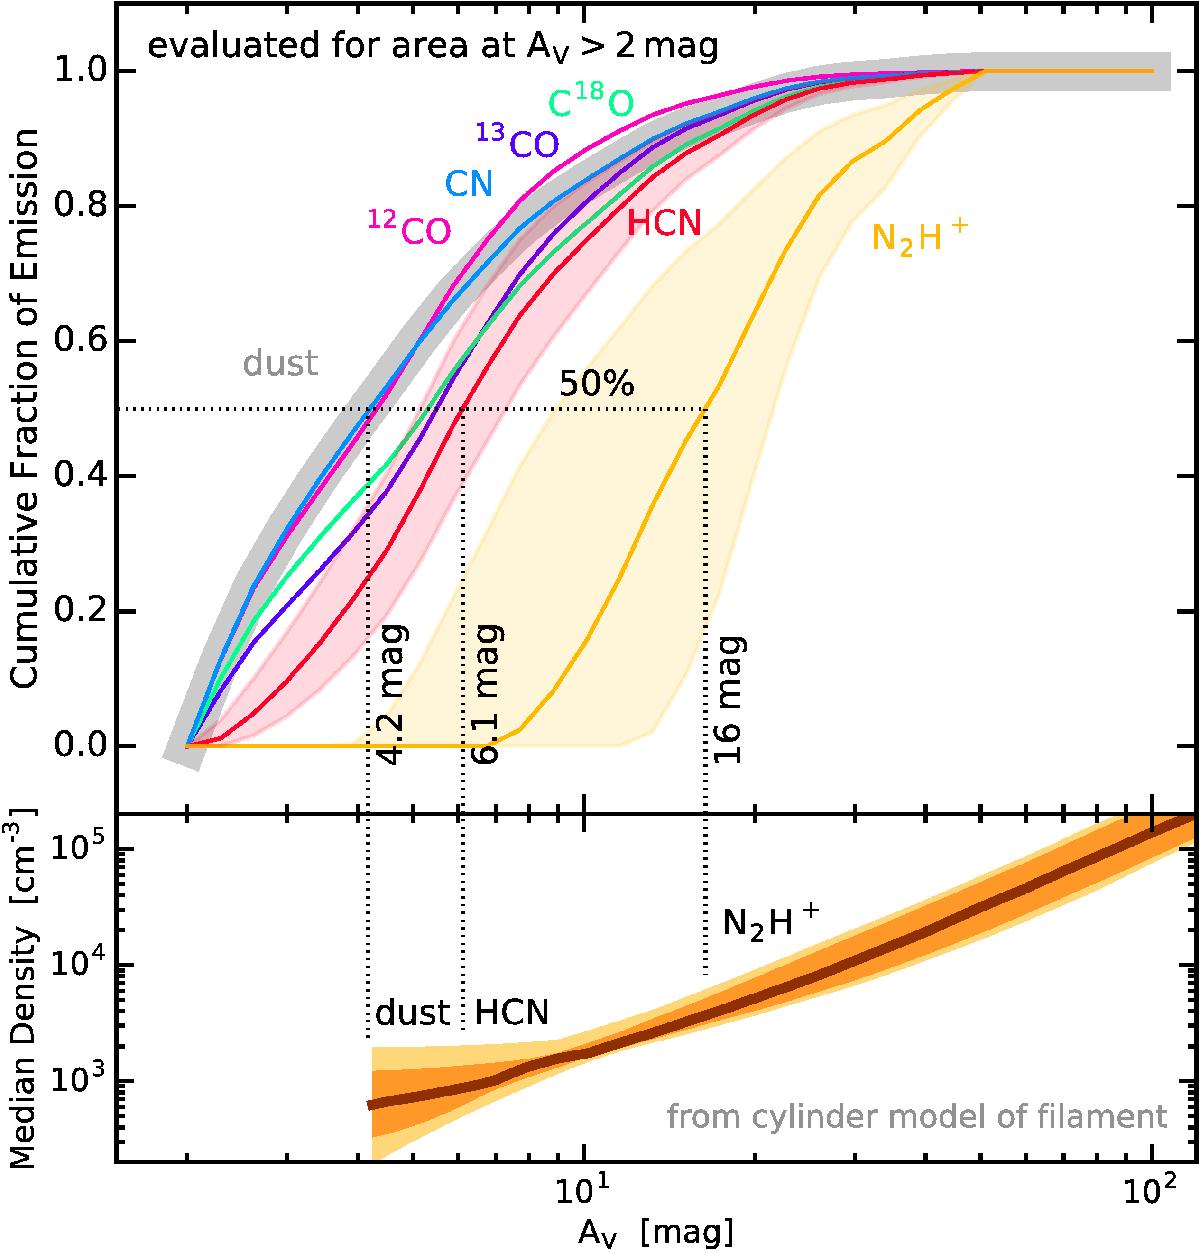
Top panel: cumulative fraction of emission for various transitions (and mass for dust) indicated by various colors. Dashed vertical lines indicate where selected transitions achieve ![]() . Shaded regions indicate uncertainties as described in Sect. 3.2. Bottom panel: estimated median density. Shading indicates confidence ranges of ± 10% and ± 40% around the median estimate.
. Shaded regions indicate uncertainties as described in Sect. 3.2. Bottom panel: estimated median density. Shading indicates confidence ranges of ± 10% and ± 40% around the median estimate.
Current usage metrics show cumulative count of Article Views (full-text article views including HTML views, PDF and ePub downloads, according to the available data) and Abstracts Views on Vision4Press platform.
Data correspond to usage on the plateform after 2015. The current usage metrics is available 48-96 hours after online publication and is updated daily on week days.
Initial download of the metrics may take a while.