Fig. 1
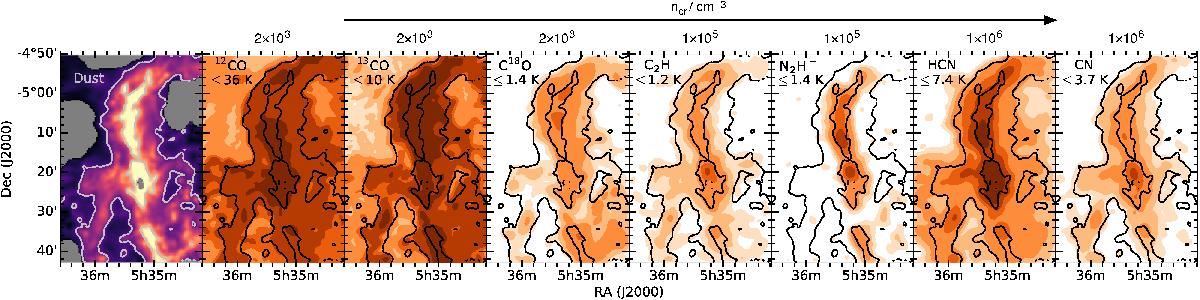
Maps of the peak intensity for transitions near 100 GHz. The left panel gives AV as inferred from Herschel data. Contours at 5 and 30 mag are drawn and repeated in all panels, and the peak intensity is stated for every transition. Line emission maps are smoothed to ![]() resolution before filled contours are drawn at signal-to-noise ratios of 3, 5, 10, 30, 50, and 100. Panels are ordered by increasing critical density, ncr.
resolution before filled contours are drawn at signal-to-noise ratios of 3, 5, 10, 30, 50, and 100. Panels are ordered by increasing critical density, ncr.
Current usage metrics show cumulative count of Article Views (full-text article views including HTML views, PDF and ePub downloads, according to the available data) and Abstracts Views on Vision4Press platform.
Data correspond to usage on the plateform after 2015. The current usage metrics is available 48-96 hours after online publication and is updated daily on week days.
Initial download of the metrics may take a while.