Free Access
Fig. 9
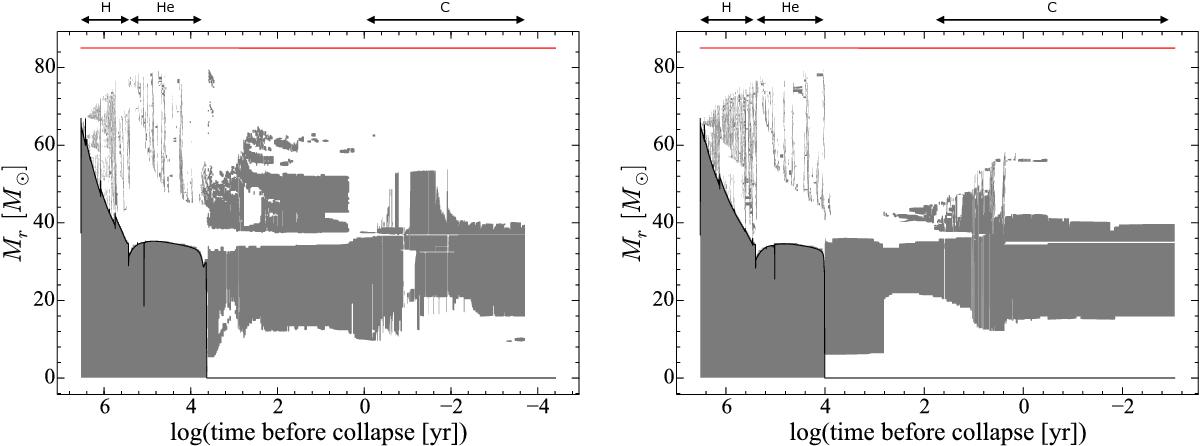
Kippenhahn diagram of the 85g0 (left) and 85g1 (right) models. Grey areas represent the convective zones. The red line at the top shows the total mass. The core hydrogen-, helium-, and carbon-burning phases are indicated at the top of the panels.
This figure is made of several images, please see below:
Current usage metrics show cumulative count of Article Views (full-text article views including HTML views, PDF and ePub downloads, according to the available data) and Abstracts Views on Vision4Press platform.
Data correspond to usage on the plateform after 2015. The current usage metrics is available 48-96 hours after online publication and is updated daily on week days.
Initial download of the metrics may take a while.