Fig. 5
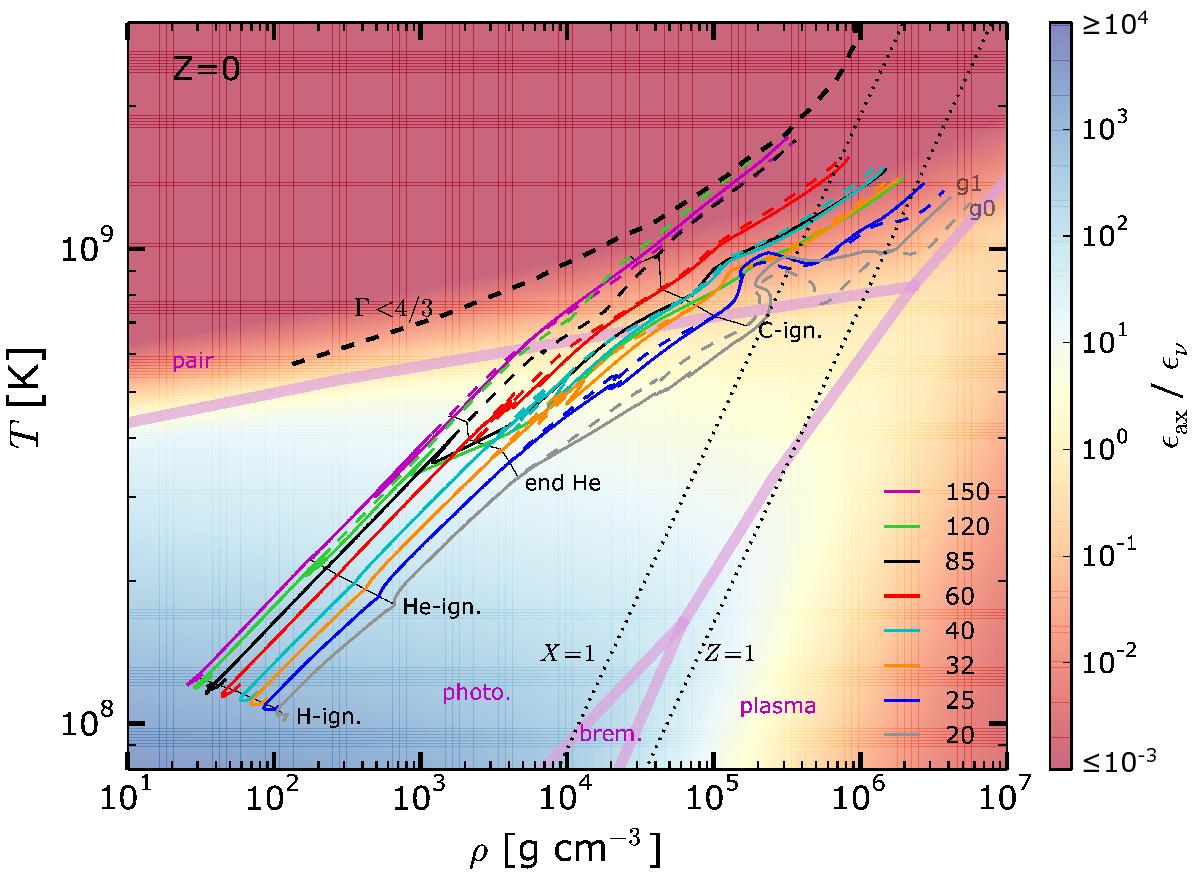
Coloured lines shows the tracks for the computed Pop. III models in the central temperature vs. central density plane. Dashed lines show models without axion losses, while solid lines show models with axion losses. The ignition of the different burning stages and the end of central helium burning are given for the models without axion losses. The broad dashed Γ < 4 / 3 line indicates the zone of the diagram where electron-positron pair creations lower the adiabatic index below 4/3. The X = 1 and Z = 1 lines show the limit between the perfect gas and the completely degenerate non-relativistic gas for pure hydrogen and pure metal mixtures. Light purple lines delimitate the different regions where a given neutrino source (pair, photoneutrino, bremsstrahlung, and plasma) dominates. The colour map shows the ratio ϵax/ϵν , where ϵν is the sum of the four types of neutrino losses mentioned above, computed according to Itoh et al. (1989, 1996).
Current usage metrics show cumulative count of Article Views (full-text article views including HTML views, PDF and ePub downloads, according to the available data) and Abstracts Views on Vision4Press platform.
Data correspond to usage on the plateform after 2015. The current usage metrics is available 48-96 hours after online publication and is updated daily on week days.
Initial download of the metrics may take a while.