Fig. 3
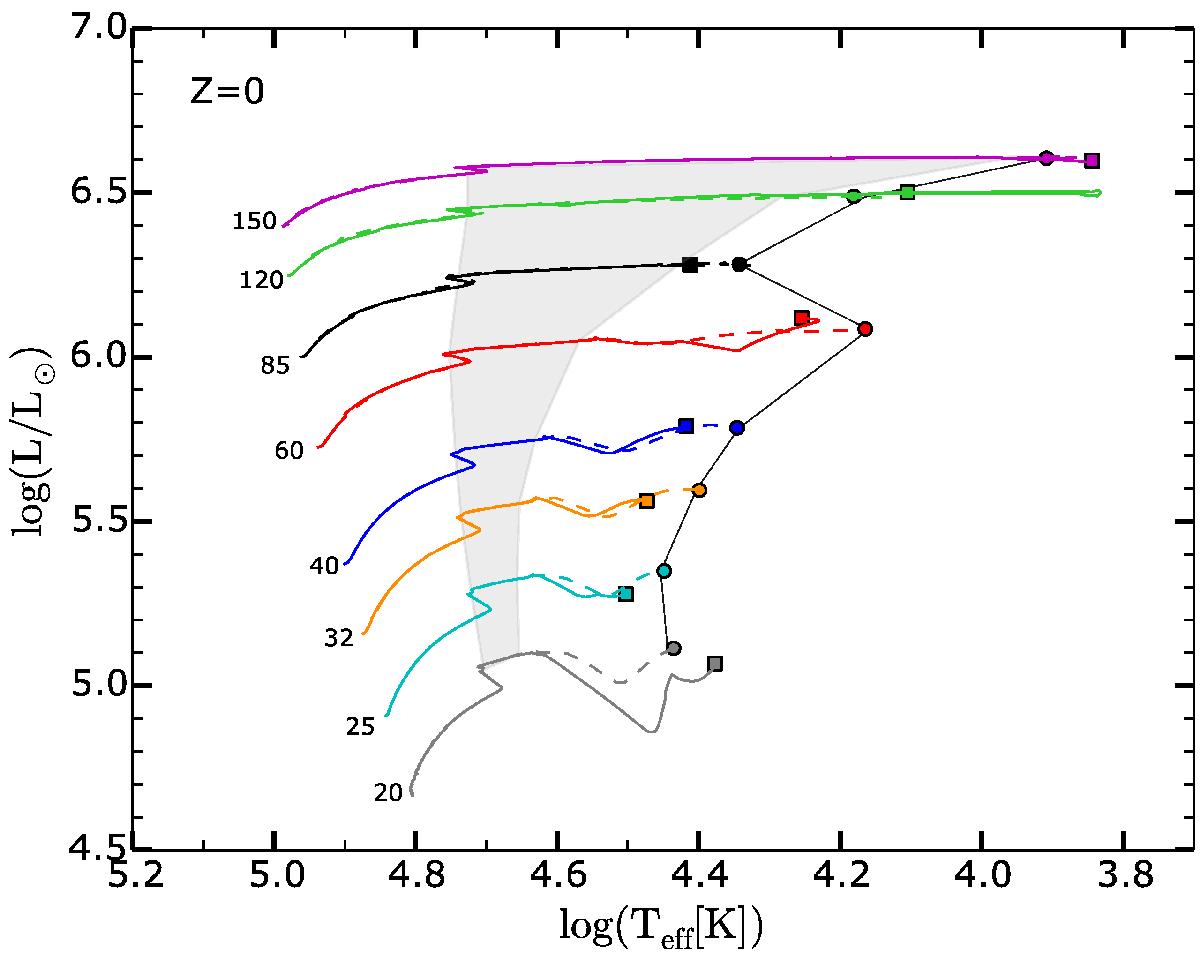
Same as Fig. 2, but for the 16 Pop. III models. The shaded area shows the zone of the diagram where helium burns in the core of the models without axion losses. The thin black line shows the location of the models without axion losses when the carbon starts to burn into the core. The shaded area and the black line are similar for models with axion losses. Circles (without axion losses) and squares (with axion losses) show the location of the models at the end of core C-burning.
Current usage metrics show cumulative count of Article Views (full-text article views including HTML views, PDF and ePub downloads, according to the available data) and Abstracts Views on Vision4Press platform.
Data correspond to usage on the plateform after 2015. The current usage metrics is available 48-96 hours after online publication and is updated daily on week days.
Initial download of the metrics may take a while.