Open Access
Fig. 9
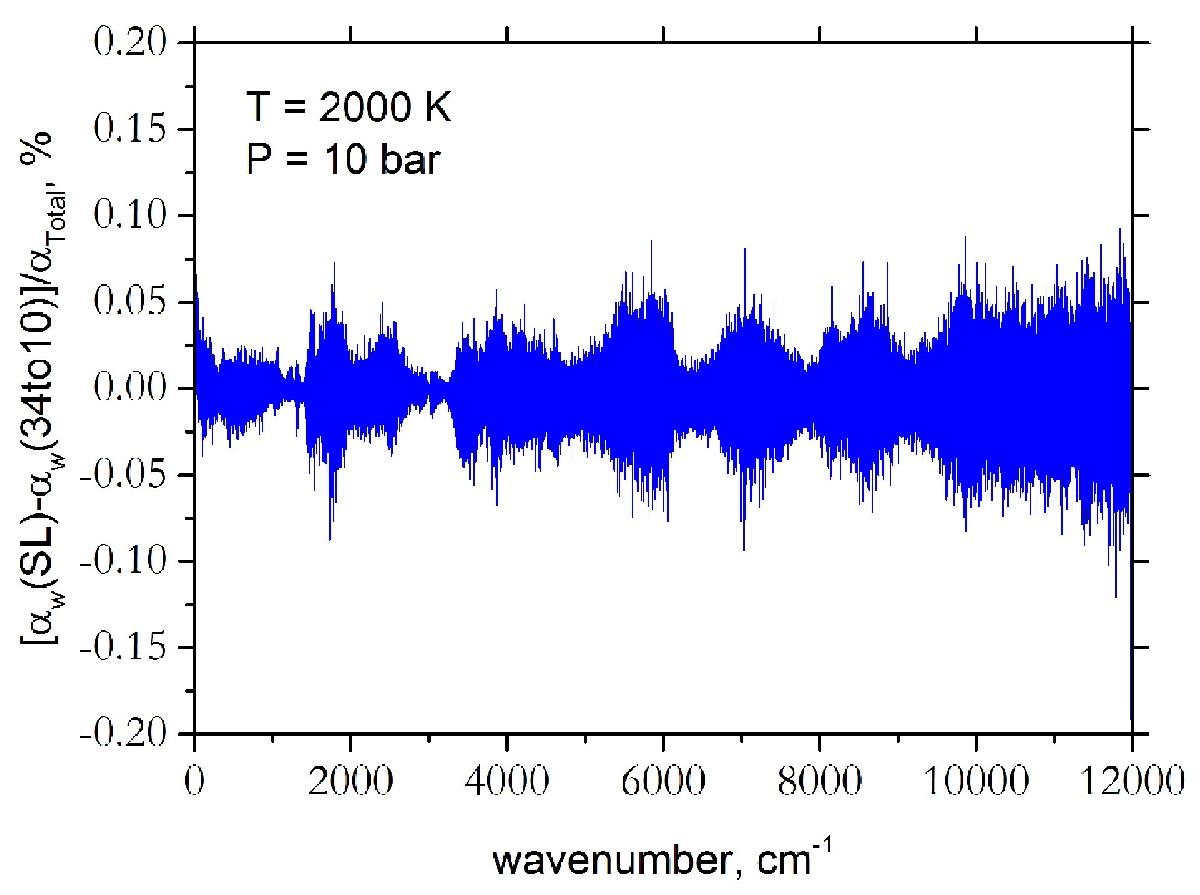
Relative errors using the histogram model R = 1 000 000 to describe the methane continuum at T = 2000 K and P = 10 bar as the difference with the 34to10 cross sections (Voigt model) relative to the total 34to10 cross sections. The wavenumber grid of ![]() cm-1 is used.
cm-1 is used.
Current usage metrics show cumulative count of Article Views (full-text article views including HTML views, PDF and ePub downloads, according to the available data) and Abstracts Views on Vision4Press platform.
Data correspond to usage on the plateform after 2015. The current usage metrics is available 48-96 hours after online publication and is updated daily on week days.
Initial download of the metrics may take a while.