Open Access
Fig. 7
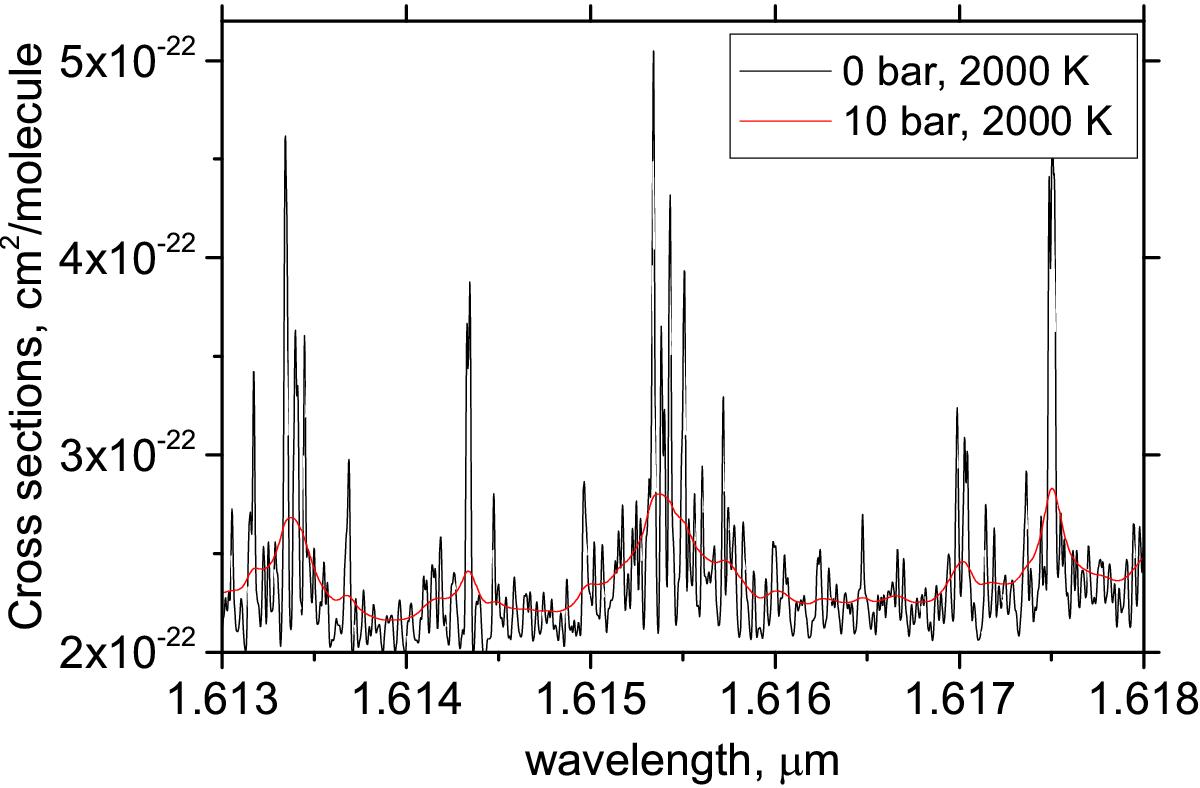
Comparison of the P = 0 and P = 10 bar line profiles used to generate cross sections at 2000 K in the region of 1.615 μm. The a0 model with the J-independent line broadening was used. The wavenumber grid ![]() is 0.01 cm-1.
is 0.01 cm-1.
Current usage metrics show cumulative count of Article Views (full-text article views including HTML views, PDF and ePub downloads, according to the available data) and Abstracts Views on Vision4Press platform.
Data correspond to usage on the plateform after 2015. The current usage metrics is available 48-96 hours after online publication and is updated daily on week days.
Initial download of the metrics may take a while.