Fig. 3
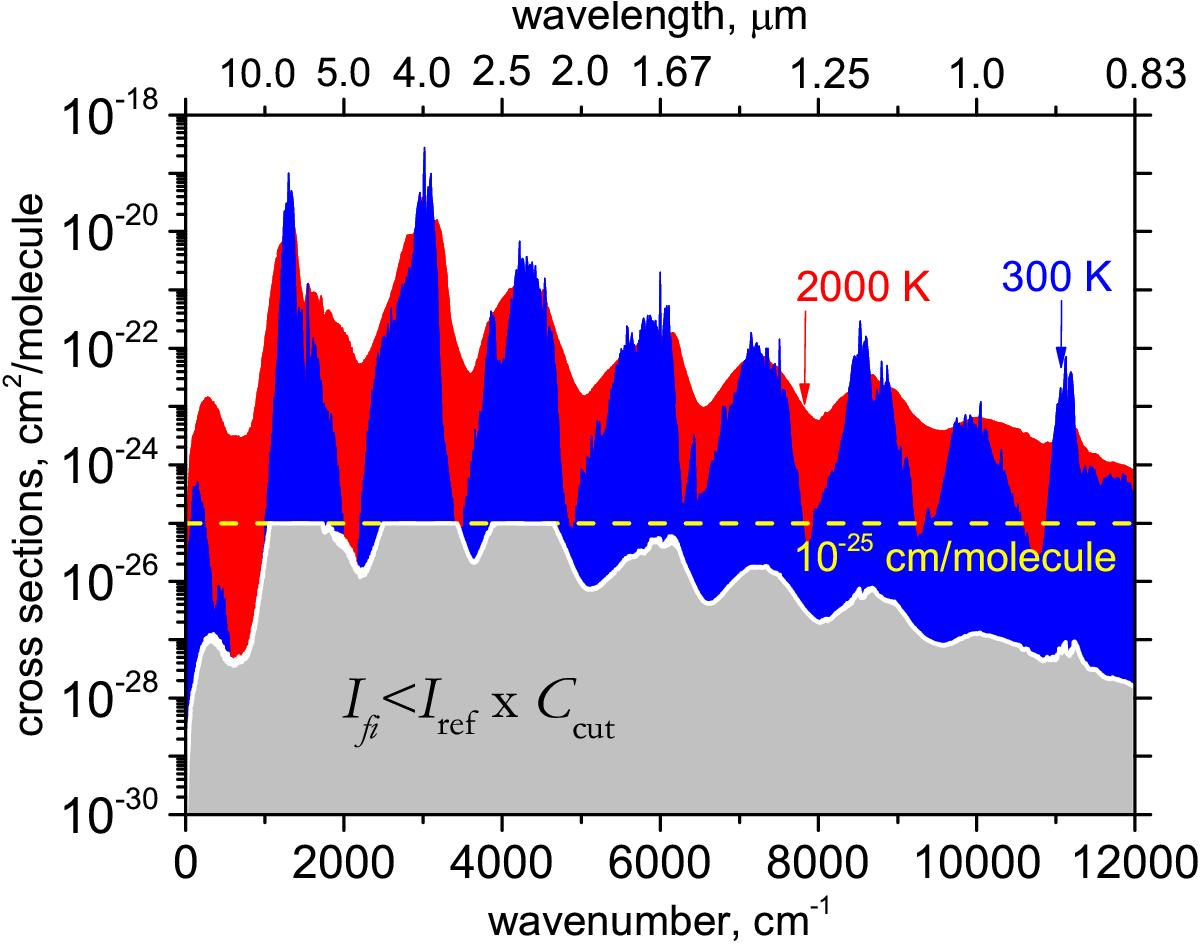
Intensity partitioning for Ithr = 10-25 cm/molecule and Cscale = 10-5. The dashed line indicates the Ithr threshold; the blue (T = 300 K) and red (T = 2000 K) areas are the regions of the strong lines; the grey area at the bottom indicates all transitions which were excluded from the line list to form the weak lines of the continuum. Here all cross sections were obtained using the Doppler profile on a grid of 10 cm-1.
Current usage metrics show cumulative count of Article Views (full-text article views including HTML views, PDF and ePub downloads, according to the available data) and Abstracts Views on Vision4Press platform.
Data correspond to usage on the plateform after 2015. The current usage metrics is available 48-96 hours after online publication and is updated daily on week days.
Initial download of the metrics may take a while.