Fig. 12
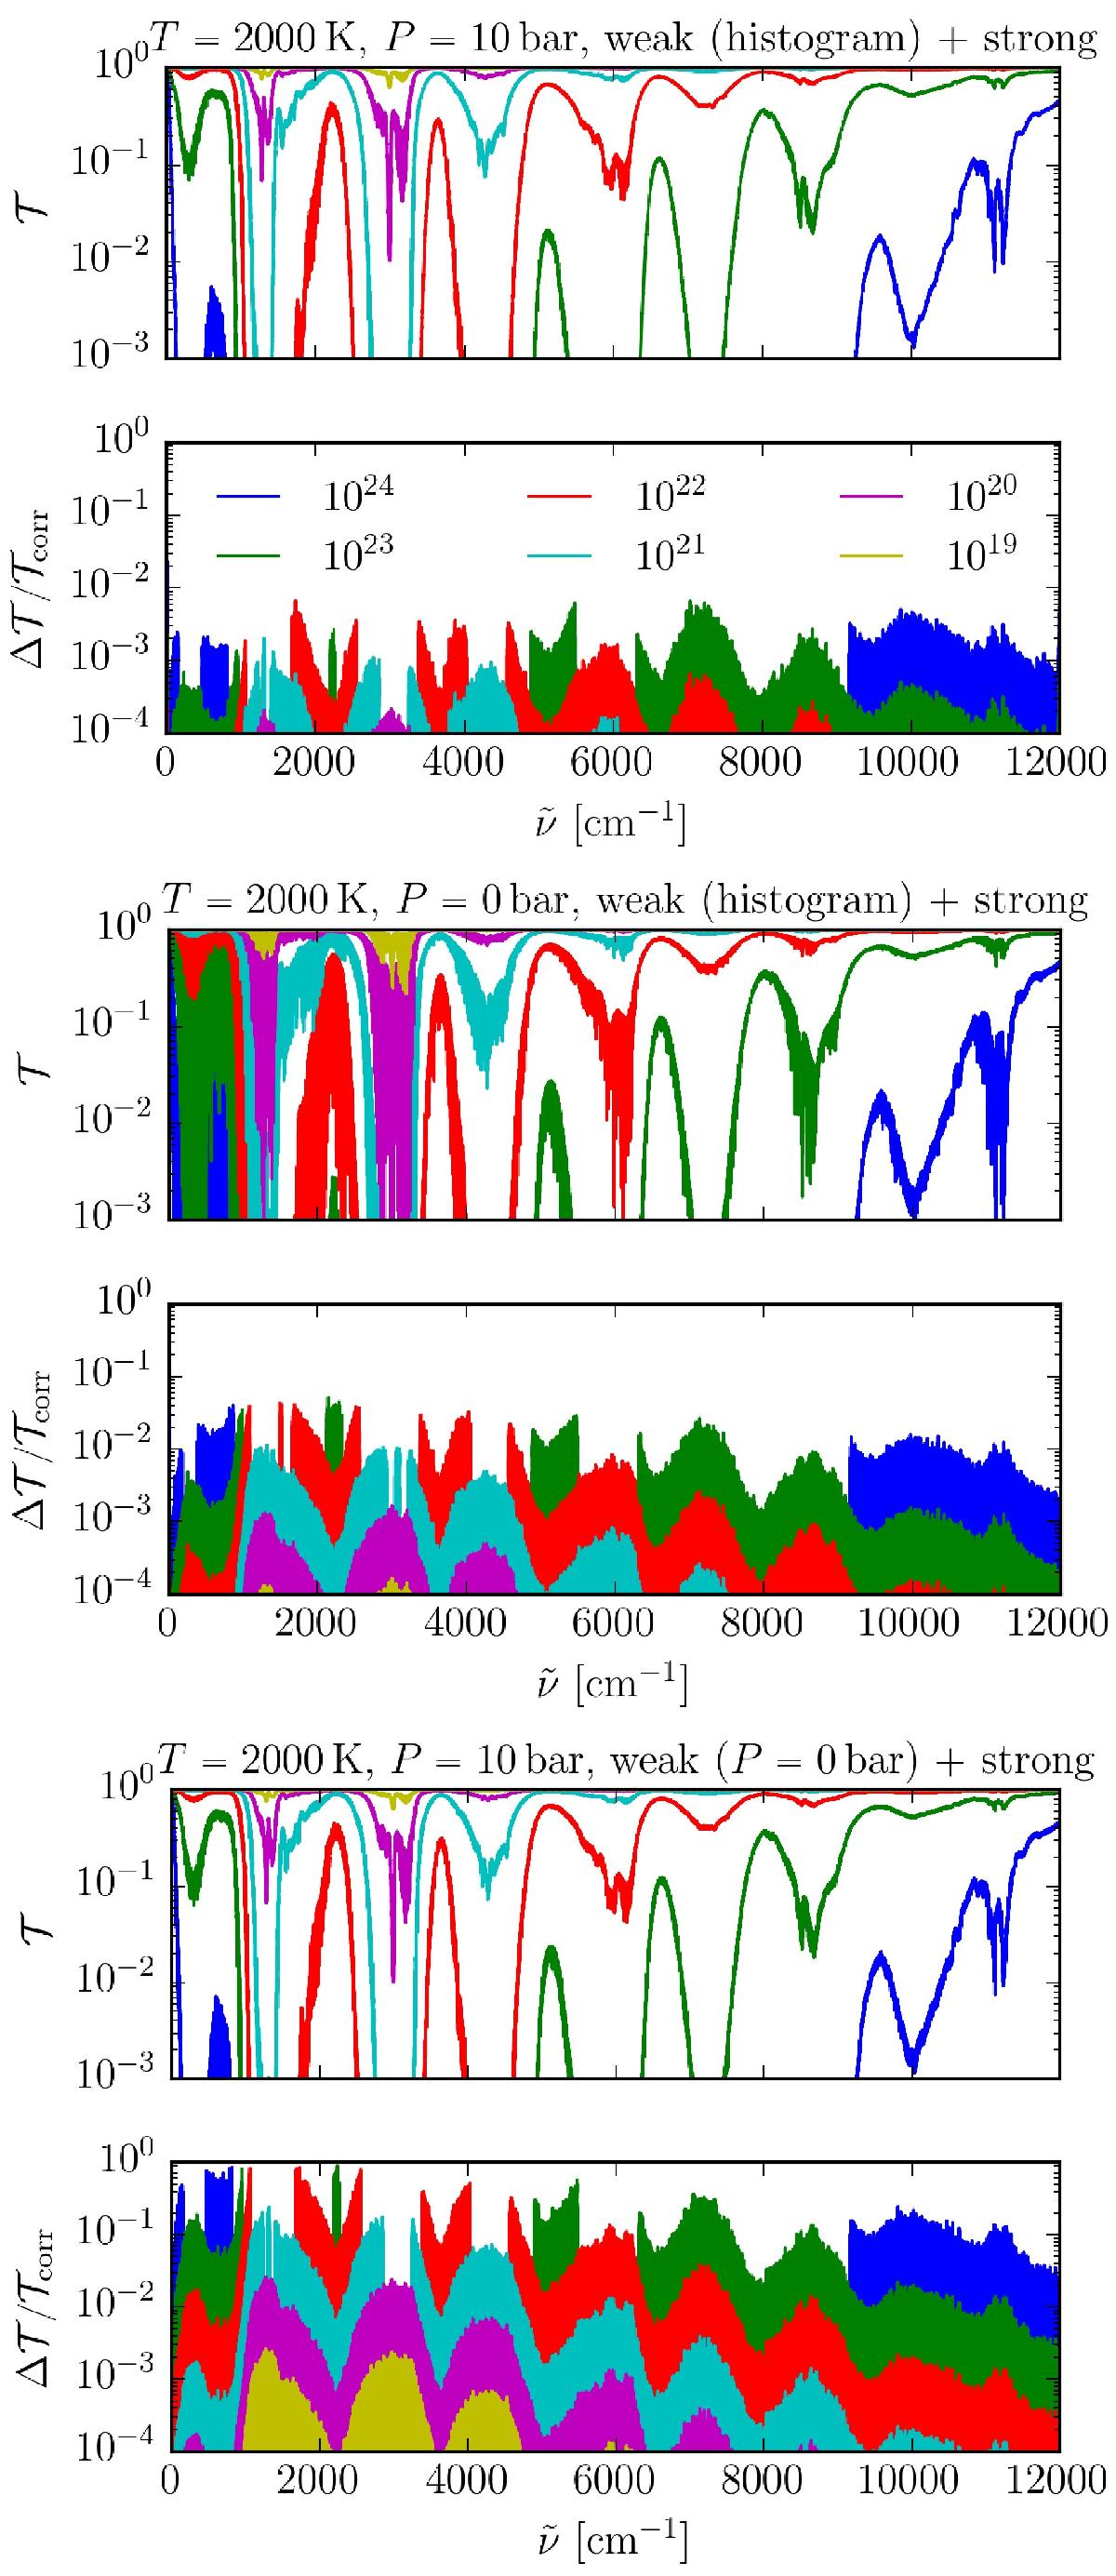
Transmissions computed using the Doppler model (upper panel) and histogram continuum models (R = 1 000 000, middle and lower panels) with relative errors for the column amounts 1019, 1020, 1021, 1022, 1023, and 1024 molecule/cm2 at T = 2000 K, P = 0 and P = 10 bar. The upper part of each panel shows the total transmission obtained from both the strong and weak lines at this temperature, while the lower part shows the relative error compared to the direct line-by-line evaluation from the 34to10 line list using the a0 Voigt model (Barton et al. 2017). The error in regions with very low transmissions (<10-4) are removed as the medium is optically thick.
Current usage metrics show cumulative count of Article Views (full-text article views including HTML views, PDF and ePub downloads, according to the available data) and Abstracts Views on Vision4Press platform.
Data correspond to usage on the plateform after 2015. The current usage metrics is available 48-96 hours after online publication and is updated daily on week days.
Initial download of the metrics may take a while.