Open Access
Fig. 1
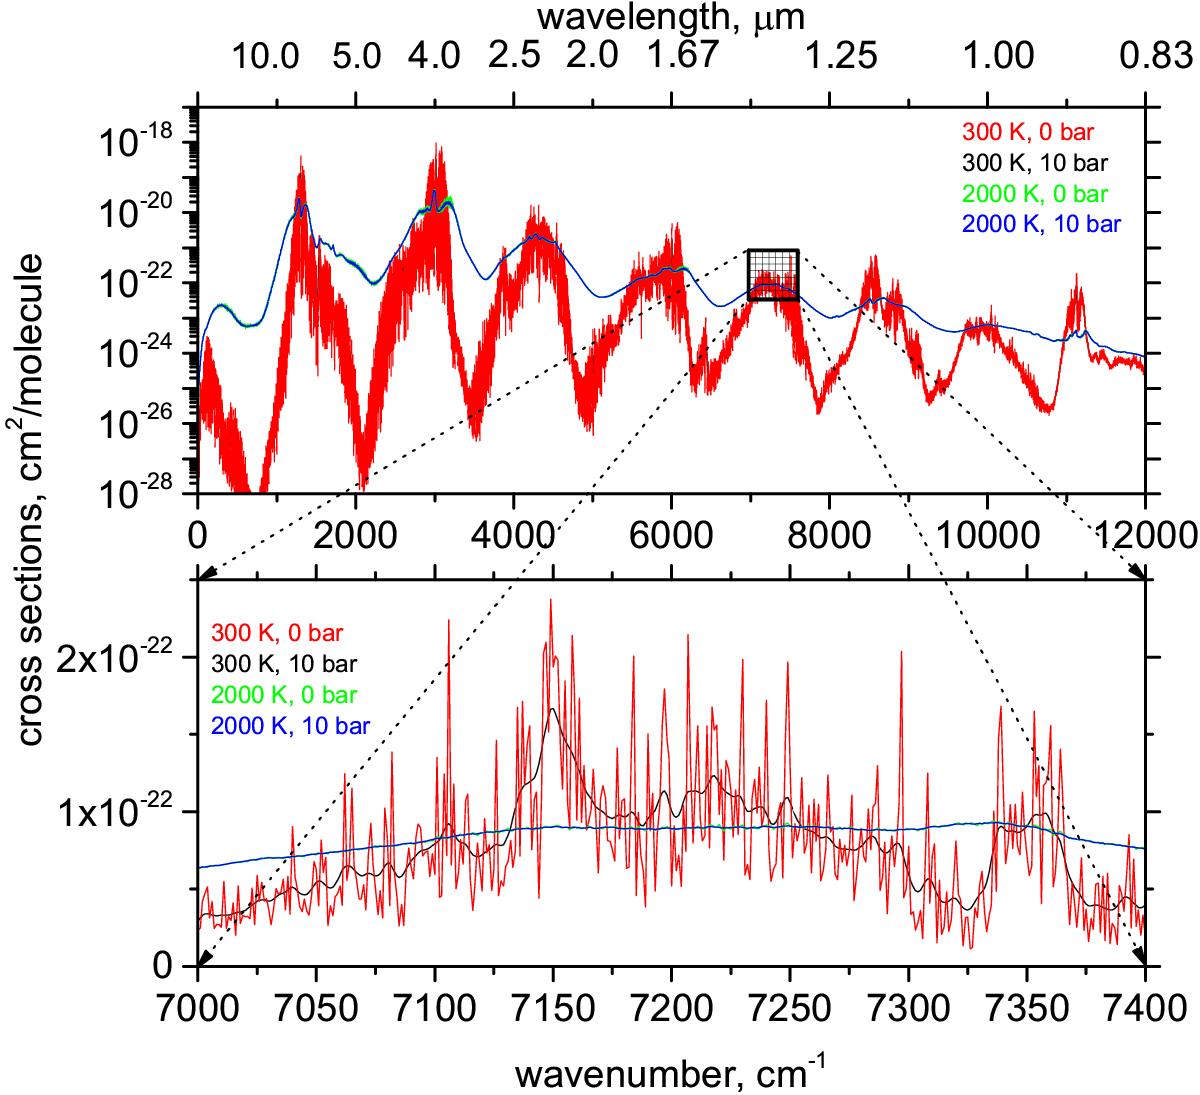
Reference cross sections obtained using the Doppler profile at T = 300 K and T = 2000 K on the uniform ![]() wavenumber grid. The green line (T = 2000 K and P = 0 bar) is almost identical to the blue line (T = 2000 K and P = 50 bar) at this region and for this scale, and thus can be barely seen.
wavenumber grid. The green line (T = 2000 K and P = 0 bar) is almost identical to the blue line (T = 2000 K and P = 50 bar) at this region and for this scale, and thus can be barely seen.
Current usage metrics show cumulative count of Article Views (full-text article views including HTML views, PDF and ePub downloads, according to the available data) and Abstracts Views on Vision4Press platform.
Data correspond to usage on the plateform after 2015. The current usage metrics is available 48-96 hours after online publication and is updated daily on week days.
Initial download of the metrics may take a while.