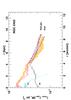
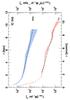
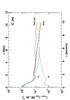
Fig. A.2
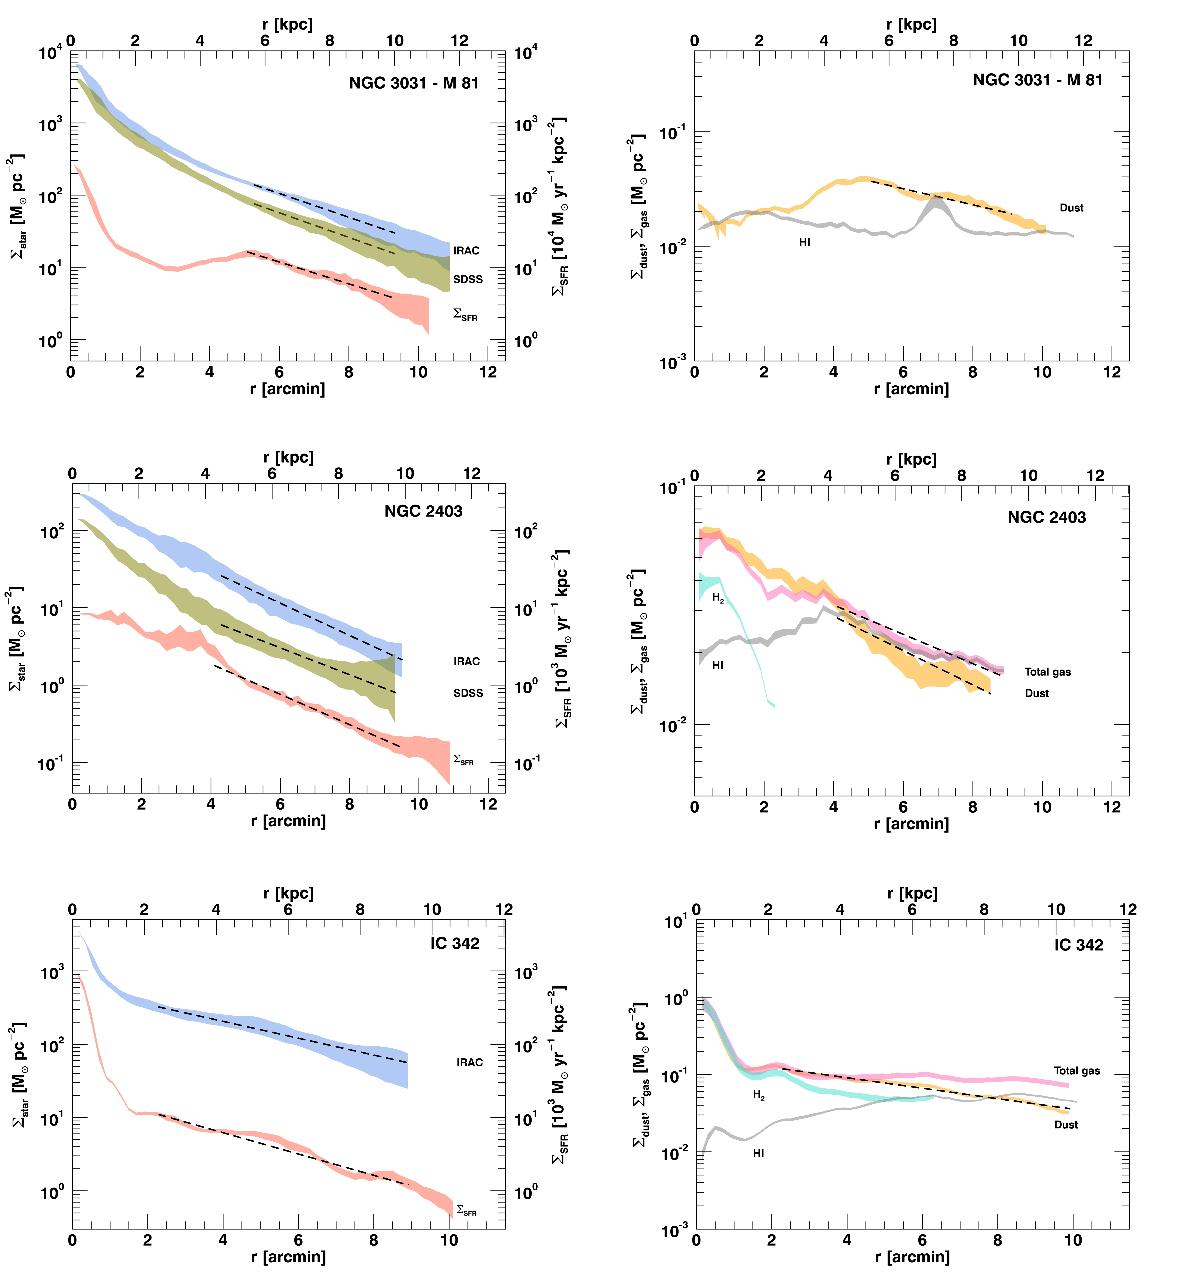
Left panel: stellar-mass surface-density profiles for the face-on DustPedia sample, except for the galaxy NGC 5457 (M 101) already displayed in the left panel of Fig. 2. The profiles are shown as in the left panel of Fig. 2. The black dashed lines are exponential fits performed avoiding the central part of galaxies in the same radius ranges of Fig. A.1 or up to the profile is available. For NGC 3621 and NGC 1097 stellar-mass surface-density profiles derived from SINGS are plotted without error bars since these profiles have overly large uncertainties to be displayed in a logarithmic scale. Right panel: surface-density profiles for the mass of dust, molecular gas, atomic gas, and total gas for the entire DustPedia face-on sample, except for NGC 5457 (M 101) already shown in the right panel of Fig. 2. The profiles are shown as in the right panel of Fig. 2.
Current usage metrics show cumulative count of Article Views (full-text article views including HTML views, PDF and ePub downloads, according to the available data) and Abstracts Views on Vision4Press platform.
Data correspond to usage on the plateform after 2015. The current usage metrics is available 48-96 hours after online publication and is updated daily on week days.
Initial download of the metrics may take a while.