Free Access
Fig. 9
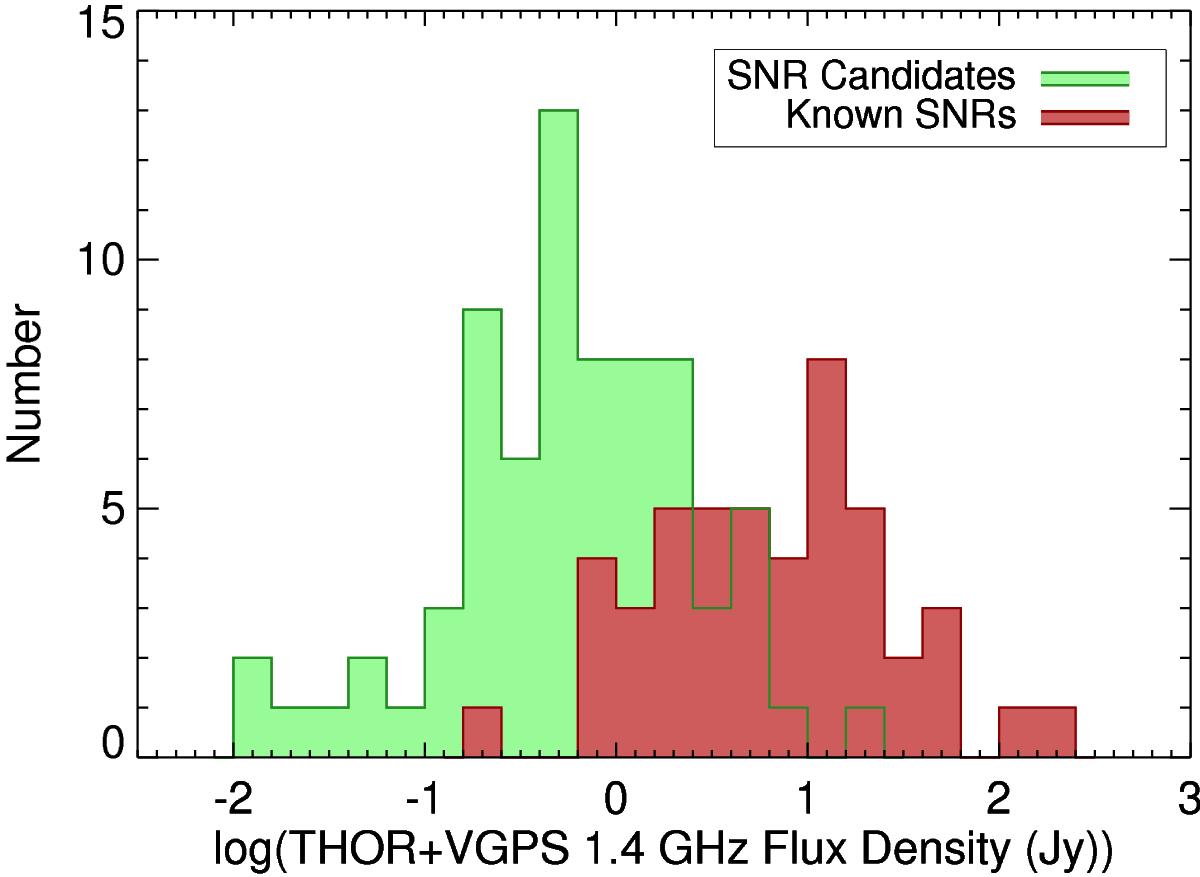
Flux density distribution of new candidate (green) and known (red) SNRs, as measured in the THOR+VGPS data. The distribution of flux densities for the new candidates is shifted toward significantly lower values compared with that of the known sample.
Current usage metrics show cumulative count of Article Views (full-text article views including HTML views, PDF and ePub downloads, according to the available data) and Abstracts Views on Vision4Press platform.
Data correspond to usage on the plateform after 2015. The current usage metrics is available 48-96 hours after online publication and is updated daily on week days.
Initial download of the metrics may take a while.