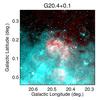
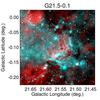
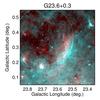
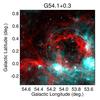
Fig. 5
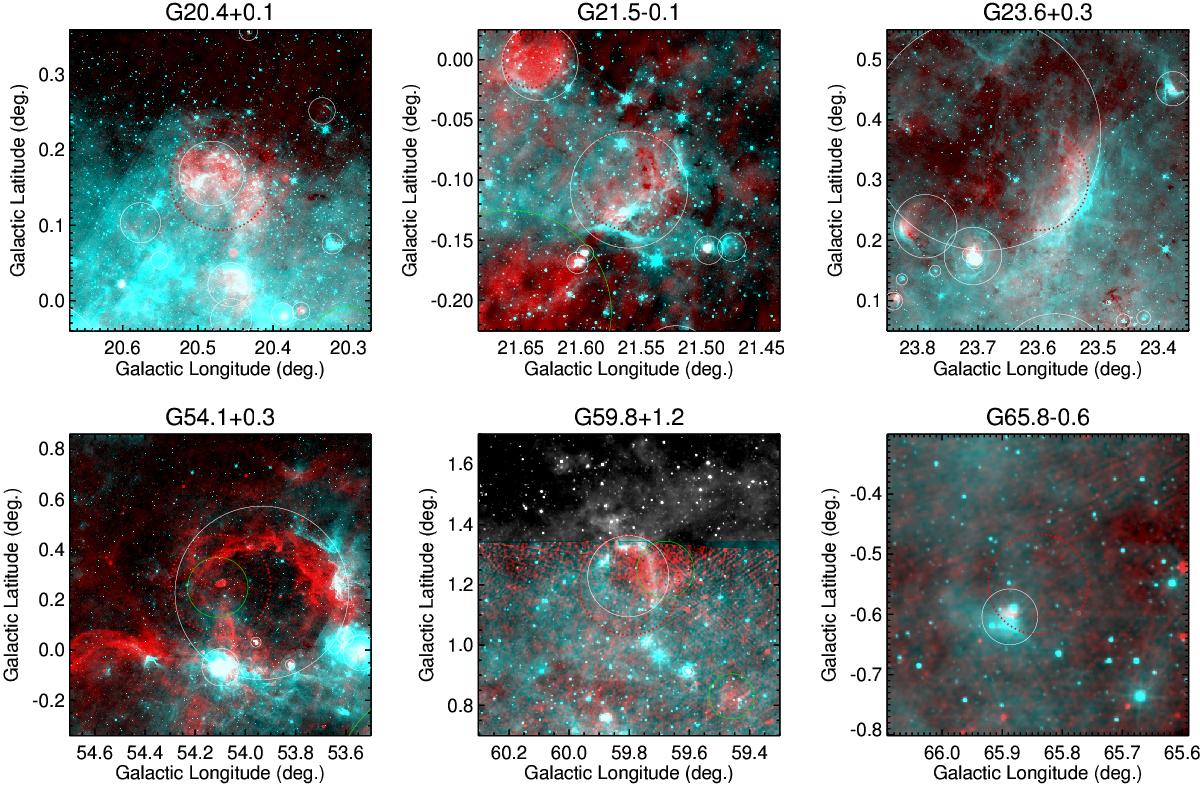
G14 SNRs confused with H ii regions. Shown for each region are two-color images with GLIMPSE 8.0 μm (for G20.4+0.1, G21.5−0.1, G23.6+0.3, and G54.1+0.3) or WISE 12 μm data (for G59.8+1.2 and G65.8−0.5) in cyan and THOR+VGPS 21 cm continuum data in red. The central positions are taken from the G14 catalog, and the image dimensions are three times the G14 SNR diameters. As in Fig. 1, the candidate SNRs are enclosed by green circles and known or candidate H ii regions by white circles. Red dotted circles show the expected position and size of the G14 SNRs that are confused with H ii regions.
Current usage metrics show cumulative count of Article Views (full-text article views including HTML views, PDF and ePub downloads, according to the available data) and Abstracts Views on Vision4Press platform.
Data correspond to usage on the plateform after 2015. The current usage metrics is available 48-96 hours after online publication and is updated daily on week days.
Initial download of the metrics may take a while.


