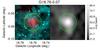
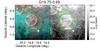
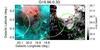
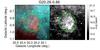
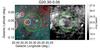
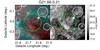
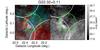
Fig. A.1
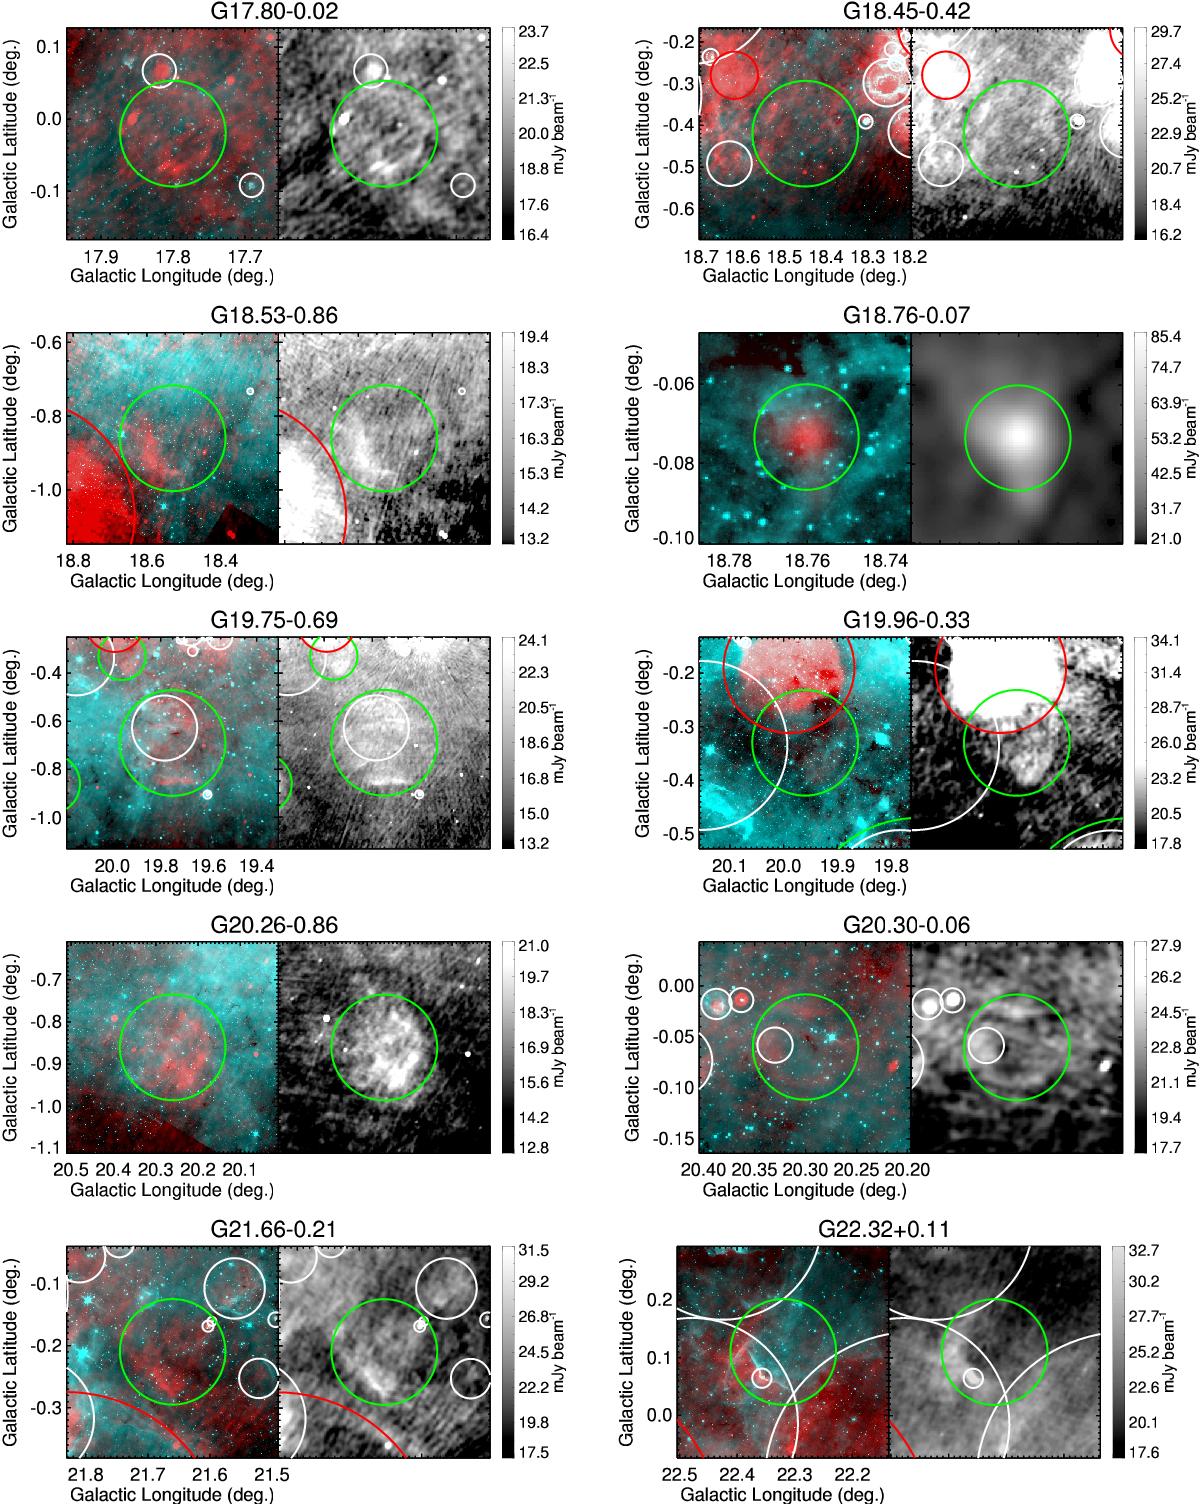
Images for all identified SNR candidates. The left panels show two-color GLIMPSE 8.0 μm (cyan) and THOR+VGPS 21 cm (red), as in Fig. 1. The right panels show THOR+VGPS data alone. Circles in both panels are the same as in Fig. 1, with candidate SNRs are enclosed by green circles, known SNRs by red circles, and known or candidate H ii regions by white circles.
Current usage metrics show cumulative count of Article Views (full-text article views including HTML views, PDF and ePub downloads, according to the available data) and Abstracts Views on Vision4Press platform.
Data correspond to usage on the plateform after 2015. The current usage metrics is available 48-96 hours after online publication and is updated daily on week days.
Initial download of the metrics may take a while.