Fig. 10
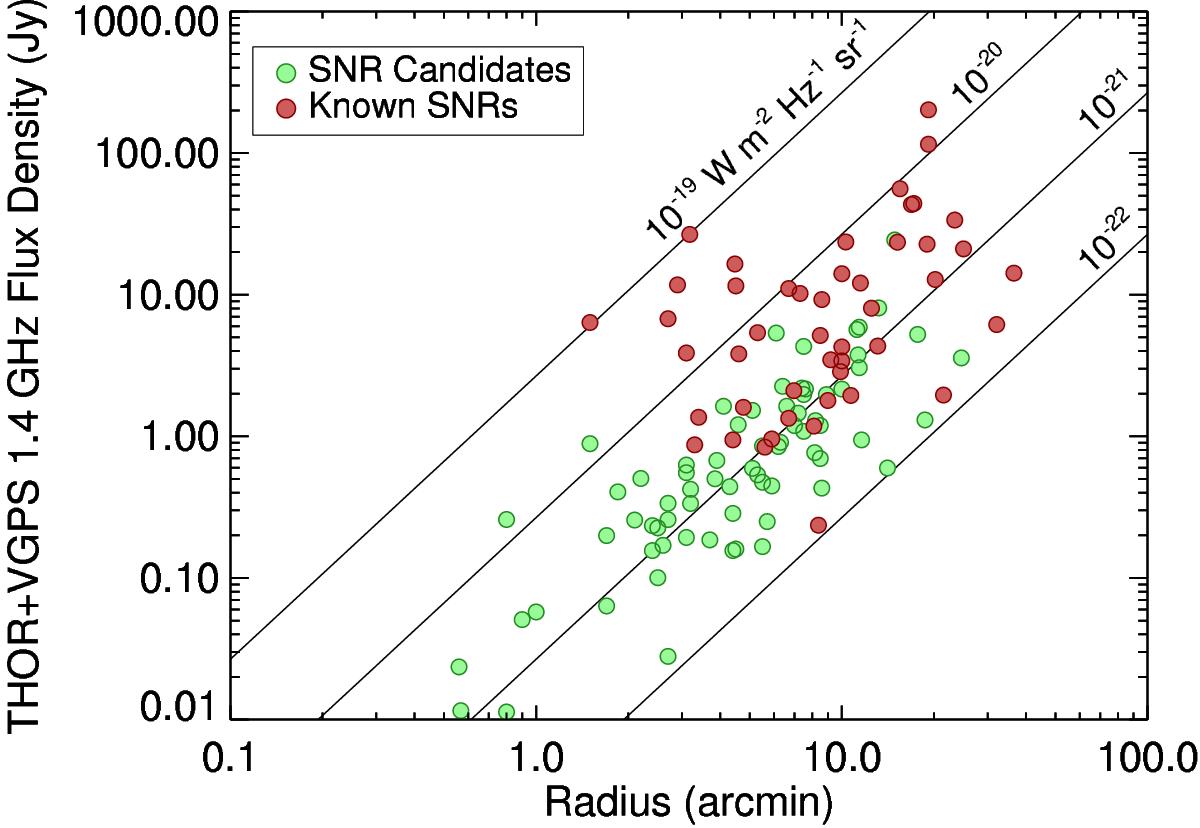
Flux density versus radius for G14 (filled circles) and candidate (plus signs) SNRs. The solid lines show surface brightness limits from 10-19 to 10-22 W m-2 Hz-1 sr-1. The surface brightness therefore decreases from the top left of the plot to the bottom right. The surface brightness distribution of the THOR SNR candidates is similar to that of the known SNRs.
Current usage metrics show cumulative count of Article Views (full-text article views including HTML views, PDF and ePub downloads, according to the available data) and Abstracts Views on Vision4Press platform.
Data correspond to usage on the plateform after 2015. The current usage metrics is available 48-96 hours after online publication and is updated daily on week days.
Initial download of the metrics may take a while.