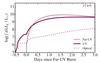
Fig. 7
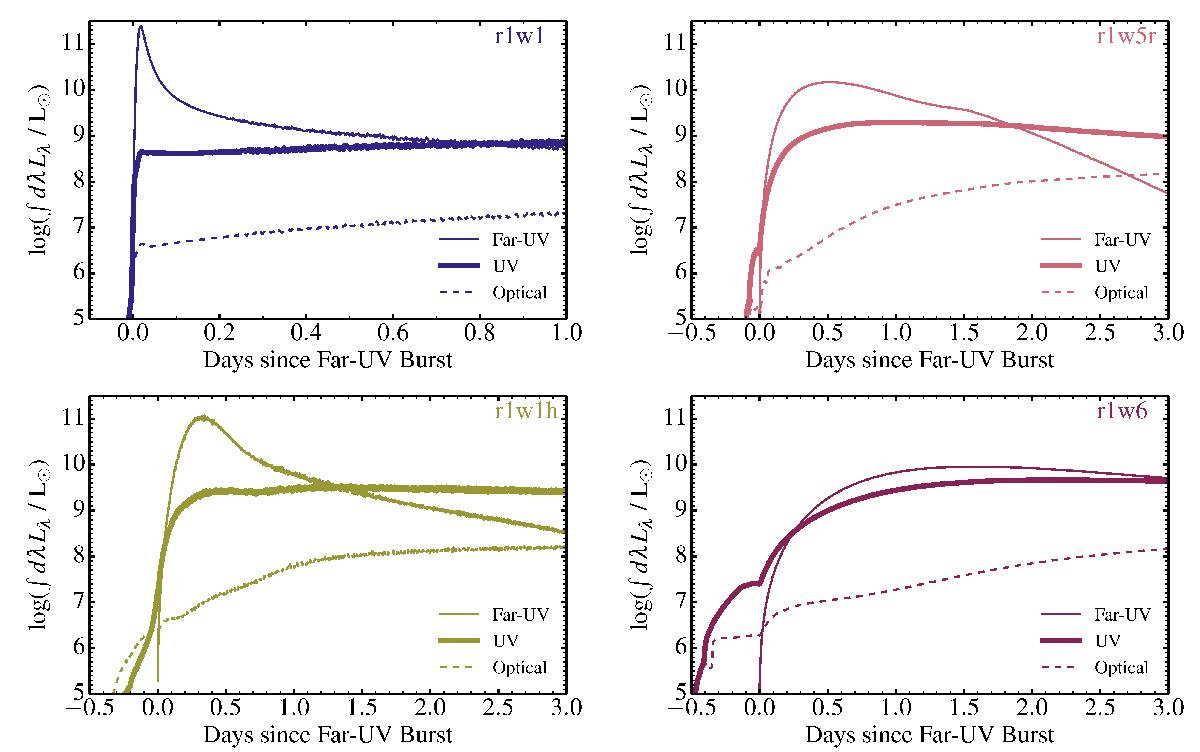
Far-UV, UV, and optical light curve computed with heracles for models r1w1, r1w1h, r1w5r, and r1w6. In practice, we show the evolution of the luminosity in the energy group number 8 (far-UV), the luminosity from energy groups 6 and 7 between the Lyman and the Balmer edges (UV), and the luminosity from energy groups 4 and 5 between the Balmer and the Paschen edges (optical). Up to one day after the far-UV burst, the bulk of the energy is emitted blueward of the Lyman edge but progressively shifts to the UV until it falls mostly in the optical after about 10 d. Models with a higher mass loss rate (right column) have a broader and redder shock breakout signal.
Current usage metrics show cumulative count of Article Views (full-text article views including HTML views, PDF and ePub downloads, according to the available data) and Abstracts Views on Vision4Press platform.
Data correspond to usage on the plateform after 2015. The current usage metrics is available 48-96 hours after online publication and is updated daily on week days.
Initial download of the metrics may take a while.