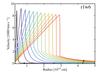
Fig. 13
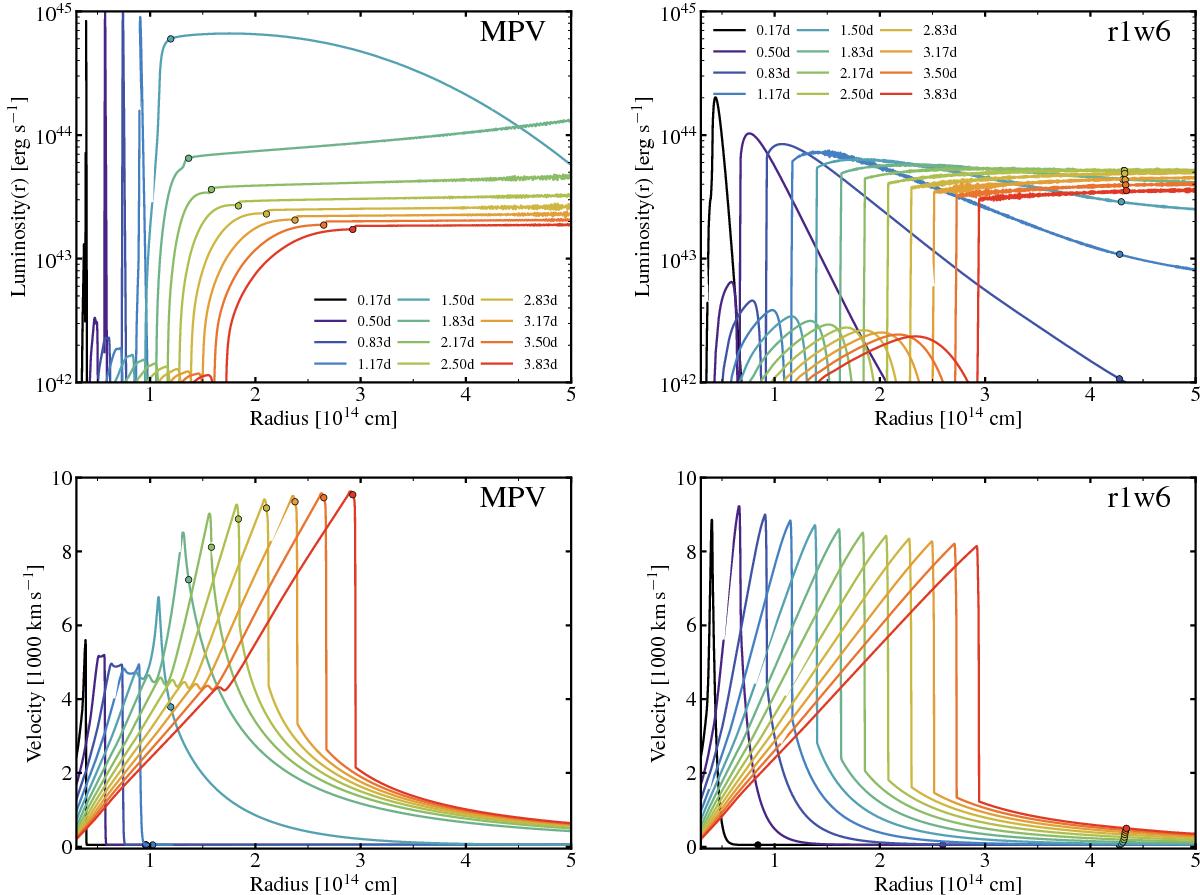
Left: evolution of the local radiative luminosity (top) and velocity (bottom) for the SN 2013fs model of Morozova et al. (2017, MPV). Right: same as left, but now for model r1w6 characterized by a dense wind (but about 50 times less dense). The filled circle is the location of the photosphere at each epoch. In all panels, the same set of epochs is shown (from 0.17 until 3.83 d after the start of the simulation). In model r1w6, the luminosity maximum occurs well below the photosphere and the slow material in between is at the origin of the narrow line profile cores with extended wings. In the configuration of MPV, this buffer of slow material is absent, there is no radiative precursor, and the event shows broad lines with blueshifted emission peaks immediately after shock breakout. The model of MPV, despite the interaction, therefore does not look like a SN IIn and does not match the earliest spectra of SN 2013fs.
Current usage metrics show cumulative count of Article Views (full-text article views including HTML views, PDF and ePub downloads, according to the available data) and Abstracts Views on Vision4Press platform.
Data correspond to usage on the plateform after 2015. The current usage metrics is available 48-96 hours after online publication and is updated daily on week days.
Initial download of the metrics may take a while.