Fig. 11
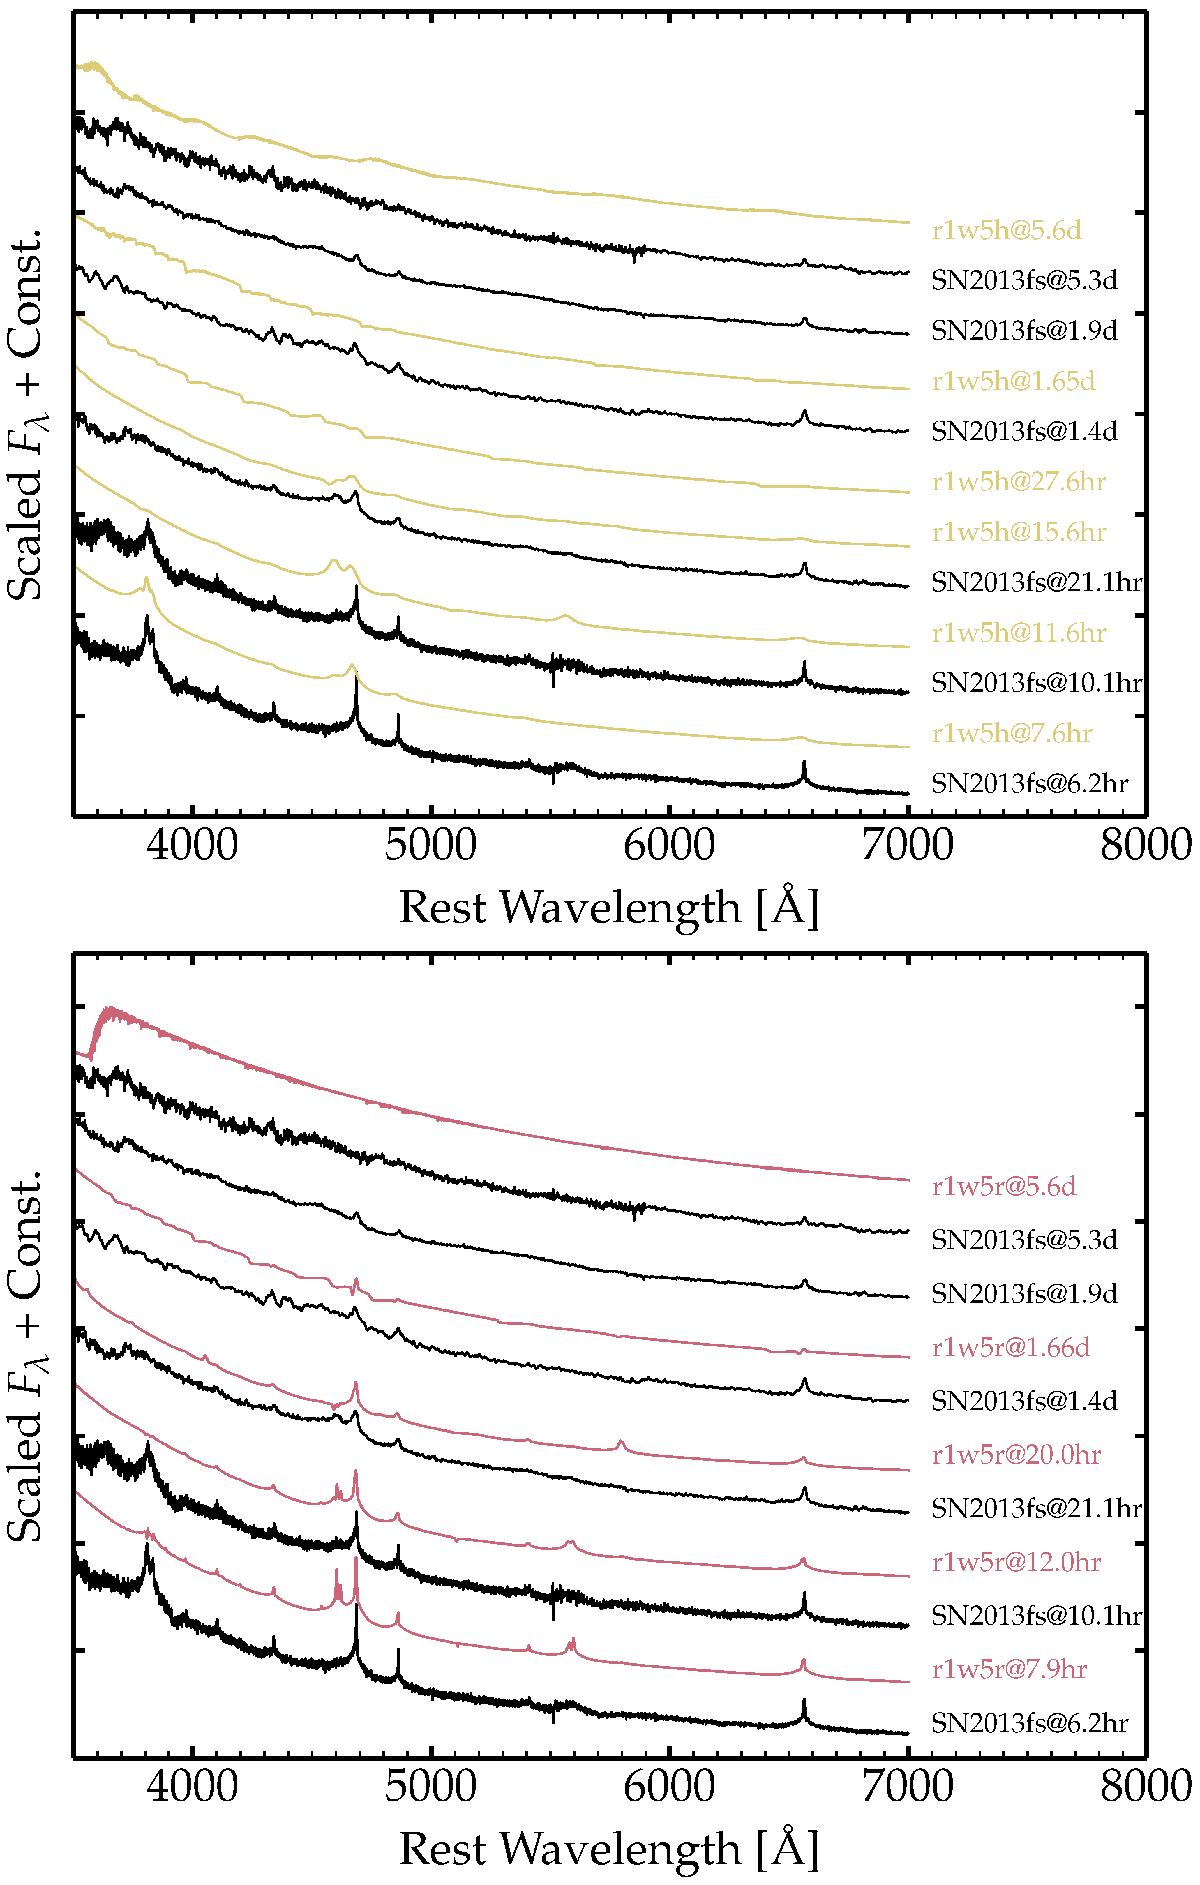
Comparison of the multi-epoch spectra of SN 2013fs at early times with the spectra for models r1w5h (top) and r1w5r (bottom). All spectra have been scaled and shifted; the ith spectrum is normalized to its maximum value within the wavelength range displayed, and then shifted by a constant equal to i × 0.25. There is one ordinate tick mark every 0.5. The observations were corrected for redshift but not for reddening. These two models roughly encompass the properties of SN 2013fs with small offsets in the persistence of some lines (e.g., Ovi 3811–3834 Å). See Sect. 5.2 for discussion.
Current usage metrics show cumulative count of Article Views (full-text article views including HTML views, PDF and ePub downloads, according to the available data) and Abstracts Views on Vision4Press platform.
Data correspond to usage on the plateform after 2015. The current usage metrics is available 48-96 hours after online publication and is updated daily on week days.
Initial download of the metrics may take a while.