Fig. 9
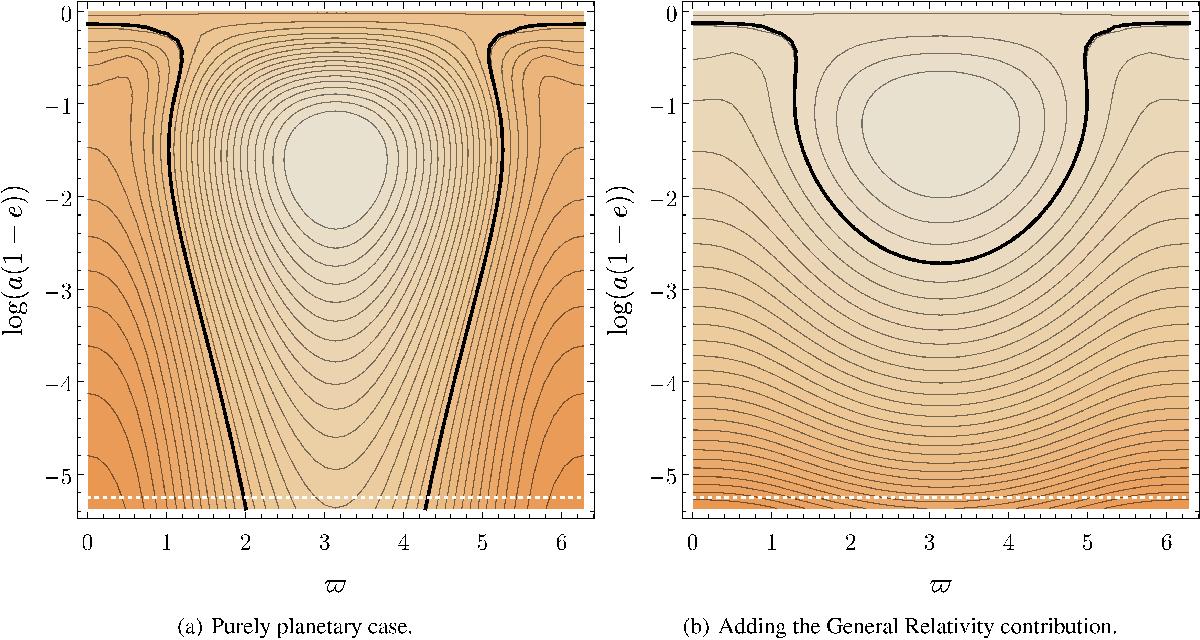
Level curves of the Hamiltonians ![]() (left panel) and
(left panel) and ![]() (right panel) on the (ϖ,log aper) plane for a test mass at ares = 1 AU in 4:1 mean motion resonance with an outer perturber with μ = 3 × 10⁻⁶, ϖ′ = 0 and e′ = 0.1. The mass of the parent star is set at M∗ = 1 M⊙. The black solid line experiencing a significant change in aperi indicates the trajectory with the initial conditions ϖ = 0 and e = 0.05. The lower edge of the plot is at the location of the radius of the star, here taken to be the radius of the Sun (R⊙). The white dotted line indicates the location of the Roche limit, calculated using a density of the test particle of ρtp = 2 g / cm3. The addition of the General Relativity potential reduces drastically the efficiency of the planetary perturbation in driving the test particle to collide with the star.
(right panel) on the (ϖ,log aper) plane for a test mass at ares = 1 AU in 4:1 mean motion resonance with an outer perturber with μ = 3 × 10⁻⁶, ϖ′ = 0 and e′ = 0.1. The mass of the parent star is set at M∗ = 1 M⊙. The black solid line experiencing a significant change in aperi indicates the trajectory with the initial conditions ϖ = 0 and e = 0.05. The lower edge of the plot is at the location of the radius of the star, here taken to be the radius of the Sun (R⊙). The white dotted line indicates the location of the Roche limit, calculated using a density of the test particle of ρtp = 2 g / cm3. The addition of the General Relativity potential reduces drastically the efficiency of the planetary perturbation in driving the test particle to collide with the star.
Current usage metrics show cumulative count of Article Views (full-text article views including HTML views, PDF and ePub downloads, according to the available data) and Abstracts Views on Vision4Press platform.
Data correspond to usage on the plateform after 2015. The current usage metrics is available 48-96 hours after online publication and is updated daily on week days.
Initial download of the metrics may take a while.