Fig. 2
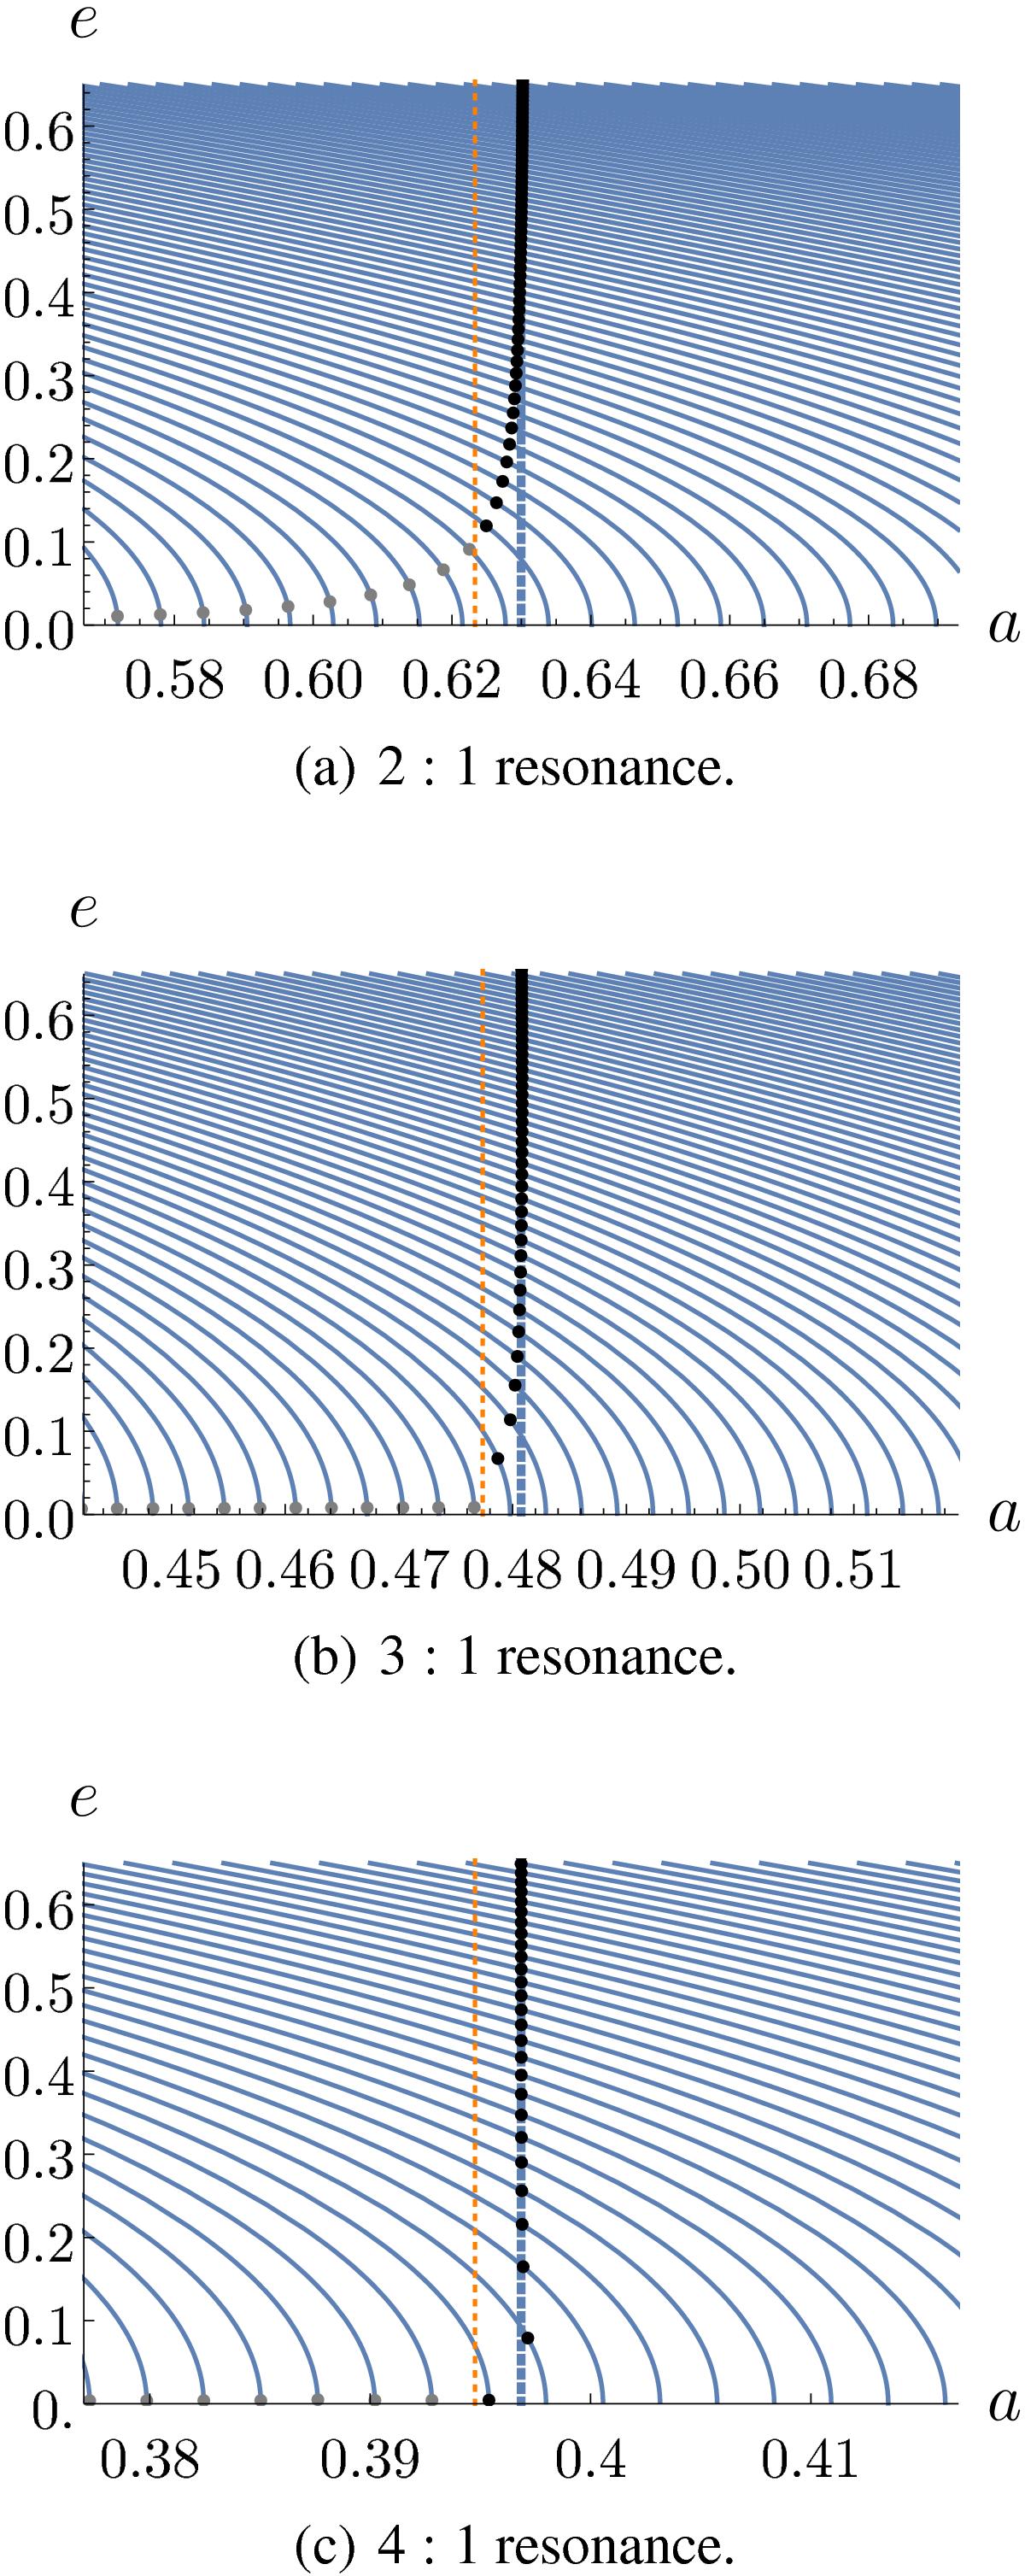
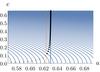
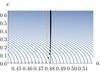
Level curves of N on the (a,e) plane for the case of the 2:1, 3:1, and 4:1 resonances with a′ = 1 AU for the perturber (in units where ![]() ). The solid lines depict Eq. (3.4), where the numerical value of N increases from left to right. The vertical thick dashed lines indicate the location of exact Keplerian resonance, ares = a′(k/k′)2 / 3. The dots represent the equilibrium values for the eccentricity and the semi-major axis on different level curves of N, while the arbitrary value of ϖ remains fixed. Here we used e′ = 0.2 and μ = 10-3. We note that the equilibrium points deviate away from exact resonance at low eccentricities, which is particularly evident in the case of first-order resonances (the 2:1 resonance in this case; see text for details). Since this deviation is linked to a faster precession of the pericentre ϖ = − p, the value of e at which this effect becomes higher than
). The solid lines depict Eq. (3.4), where the numerical value of N increases from left to right. The vertical thick dashed lines indicate the location of exact Keplerian resonance, ares = a′(k/k′)2 / 3. The dots represent the equilibrium values for the eccentricity and the semi-major axis on different level curves of N, while the arbitrary value of ϖ remains fixed. Here we used e′ = 0.2 and μ = 10-3. We note that the equilibrium points deviate away from exact resonance at low eccentricities, which is particularly evident in the case of first-order resonances (the 2:1 resonance in this case; see text for details). Since this deviation is linked to a faster precession of the pericentre ϖ = − p, the value of e at which this effect becomes higher than ![]() yields a lower bound in e above which our approach is valid. The orange dashed line indicates a deviation from the exact resonance of this amount. We thus colour-coded the equilibrium points using black for those that fall above this lower limit in eccentricity, and grey for those that fall below it: for the latter, the fast change in p does not allow us to consider the pair (N,p) as slowly evolving variables.
yields a lower bound in e above which our approach is valid. The orange dashed line indicates a deviation from the exact resonance of this amount. We thus colour-coded the equilibrium points using black for those that fall above this lower limit in eccentricity, and grey for those that fall below it: for the latter, the fast change in p does not allow us to consider the pair (N,p) as slowly evolving variables.
Current usage metrics show cumulative count of Article Views (full-text article views including HTML views, PDF and ePub downloads, according to the available data) and Abstracts Views on Vision4Press platform.
Data correspond to usage on the plateform after 2015. The current usage metrics is available 48-96 hours after online publication and is updated daily on week days.
Initial download of the metrics may take a while.