Fig. 3
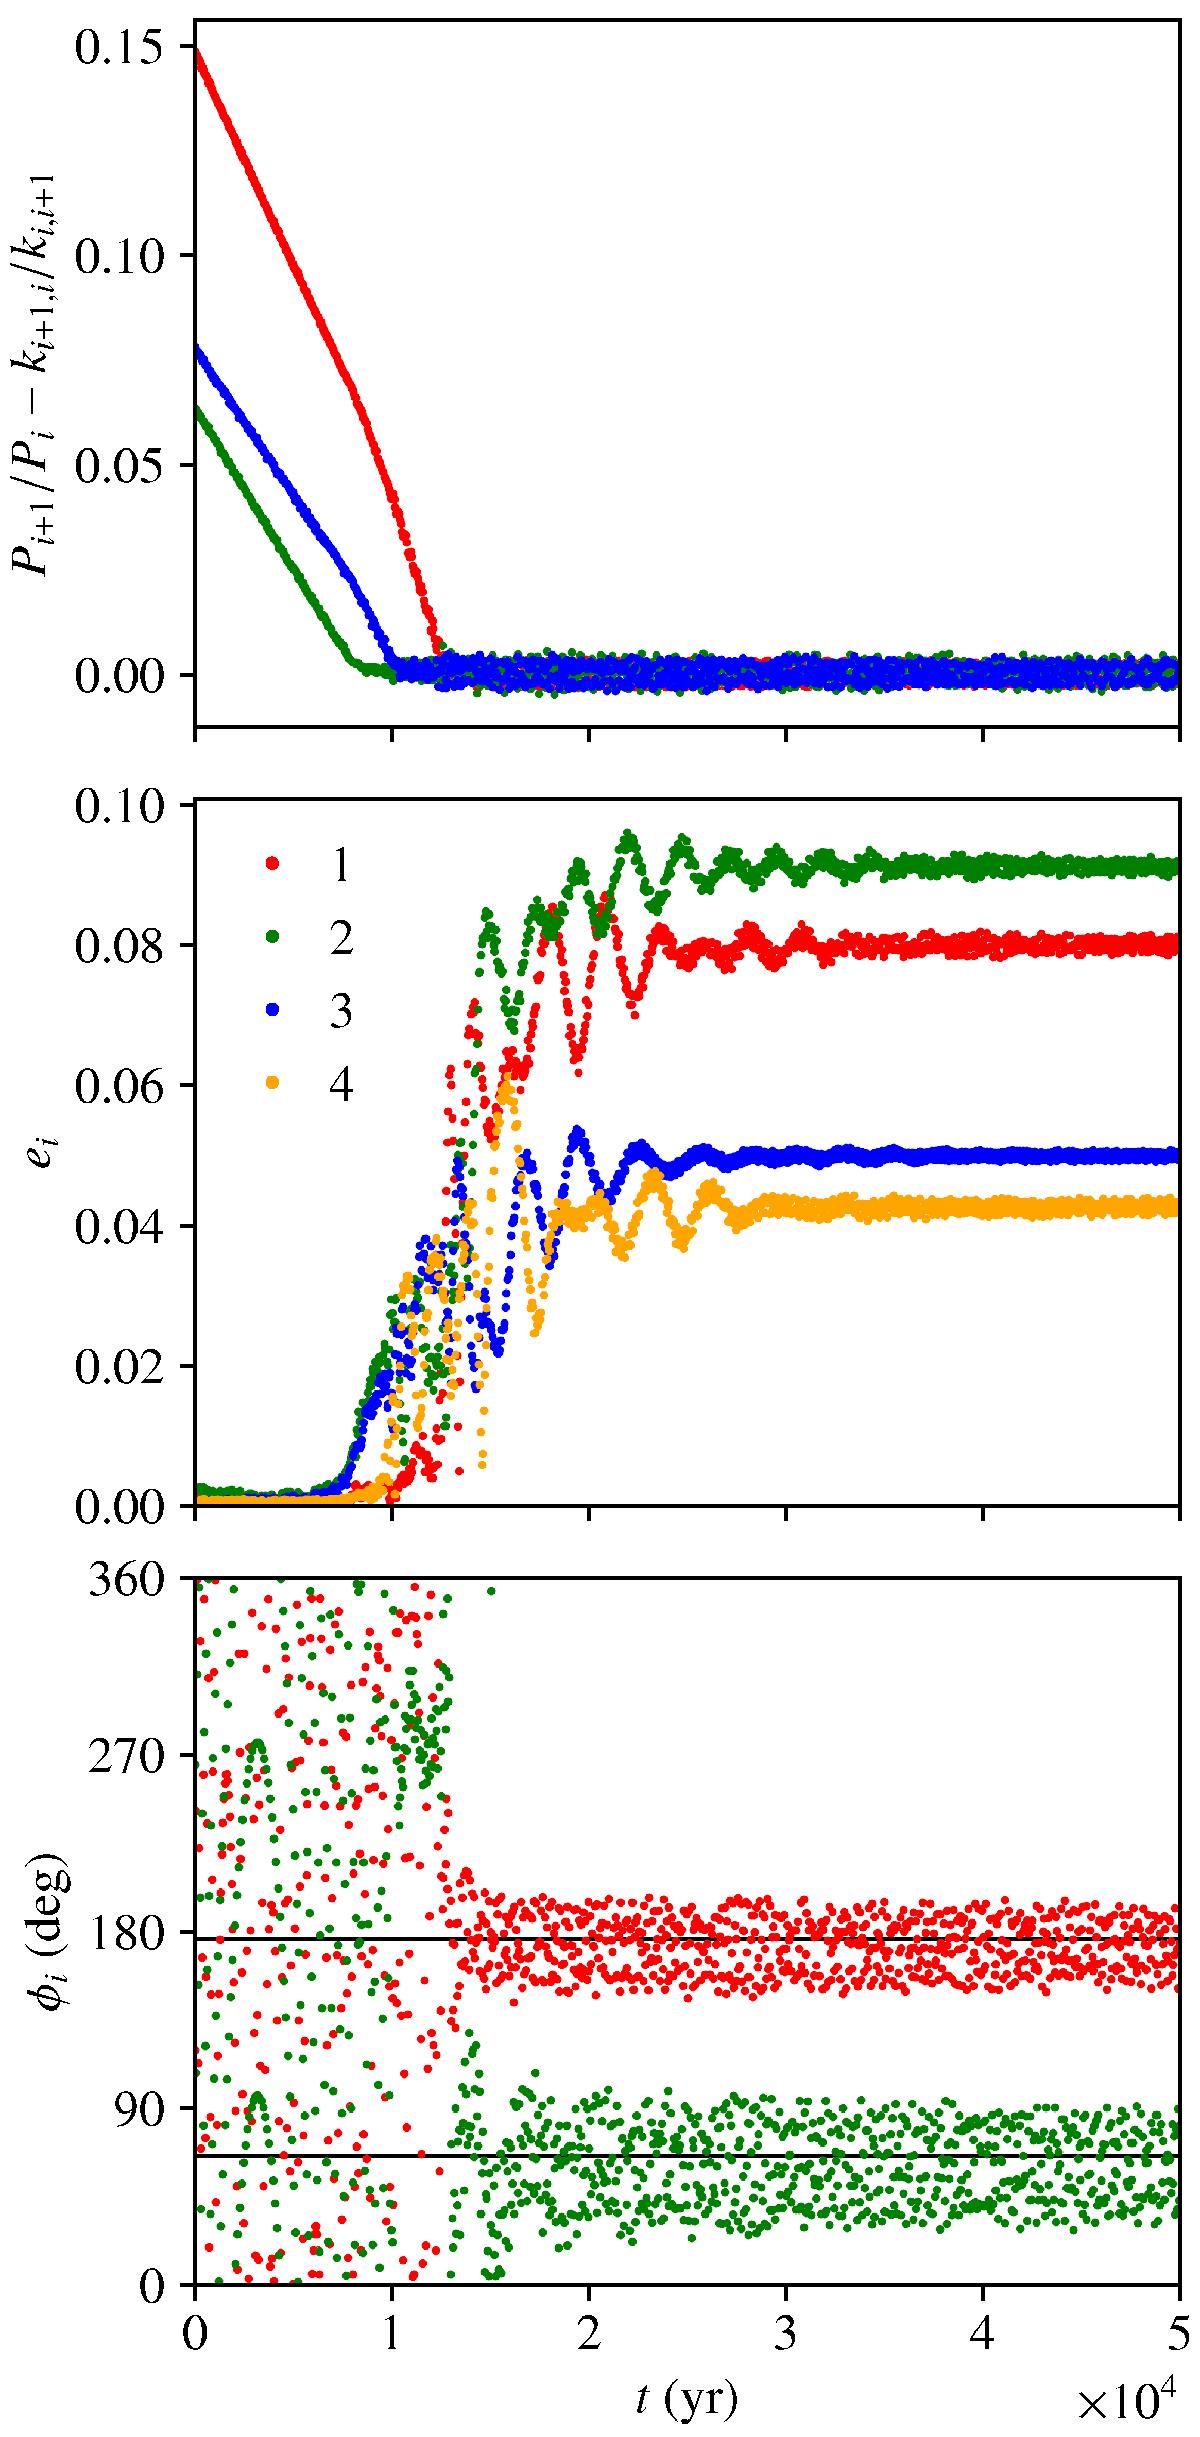
Example of a simulation that successfully reproduces the observed configuration of the Kepler-223 system. The scenario of capture is of type BCA (see Sect. 3.2). I plot the period ratio between each consecutive pair of planets (top), the planets’ eccentricities (middle), and the two Laplace angles (bottom). The two horizontal black lines in the bottom plot represent the equilibrium values of the Laplace angles expected from the analytical model (see Sect. 3.1).
Current usage metrics show cumulative count of Article Views (full-text article views including HTML views, PDF and ePub downloads, according to the available data) and Abstracts Views on Vision4Press platform.
Data correspond to usage on the plateform after 2015. The current usage metrics is available 48-96 hours after online publication and is updated daily on week days.
Initial download of the metrics may take a while.