Fig. 8
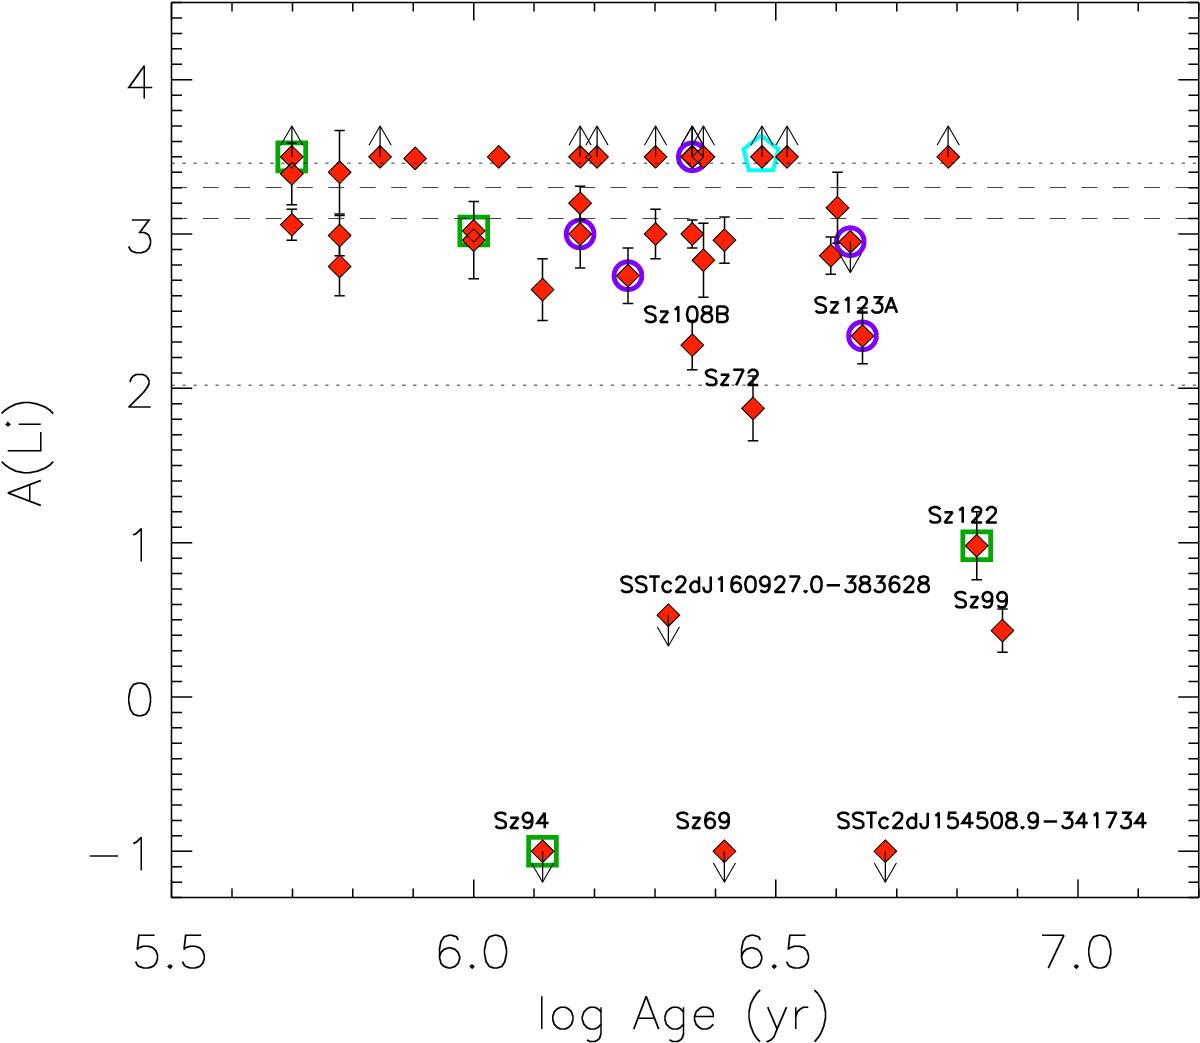
Li abundance versus age for stars with mass in the range 0.2−0.5 M⊙. Symbols are the same as in Fig. 3. The dashed horizontal lines mark the region of the interstellar lithium abundance (3.1–3.3 dex). Dotted lines represent ± 1σ from the mean lithium abundance of this sub-sample. The labeled stars are those discussed in the text.
Current usage metrics show cumulative count of Article Views (full-text article views including HTML views, PDF and ePub downloads, according to the available data) and Abstracts Views on Vision4Press platform.
Data correspond to usage on the plateform after 2015. The current usage metrics is available 48-96 hours after online publication and is updated daily on week days.
Initial download of the metrics may take a while.