Fig. 3
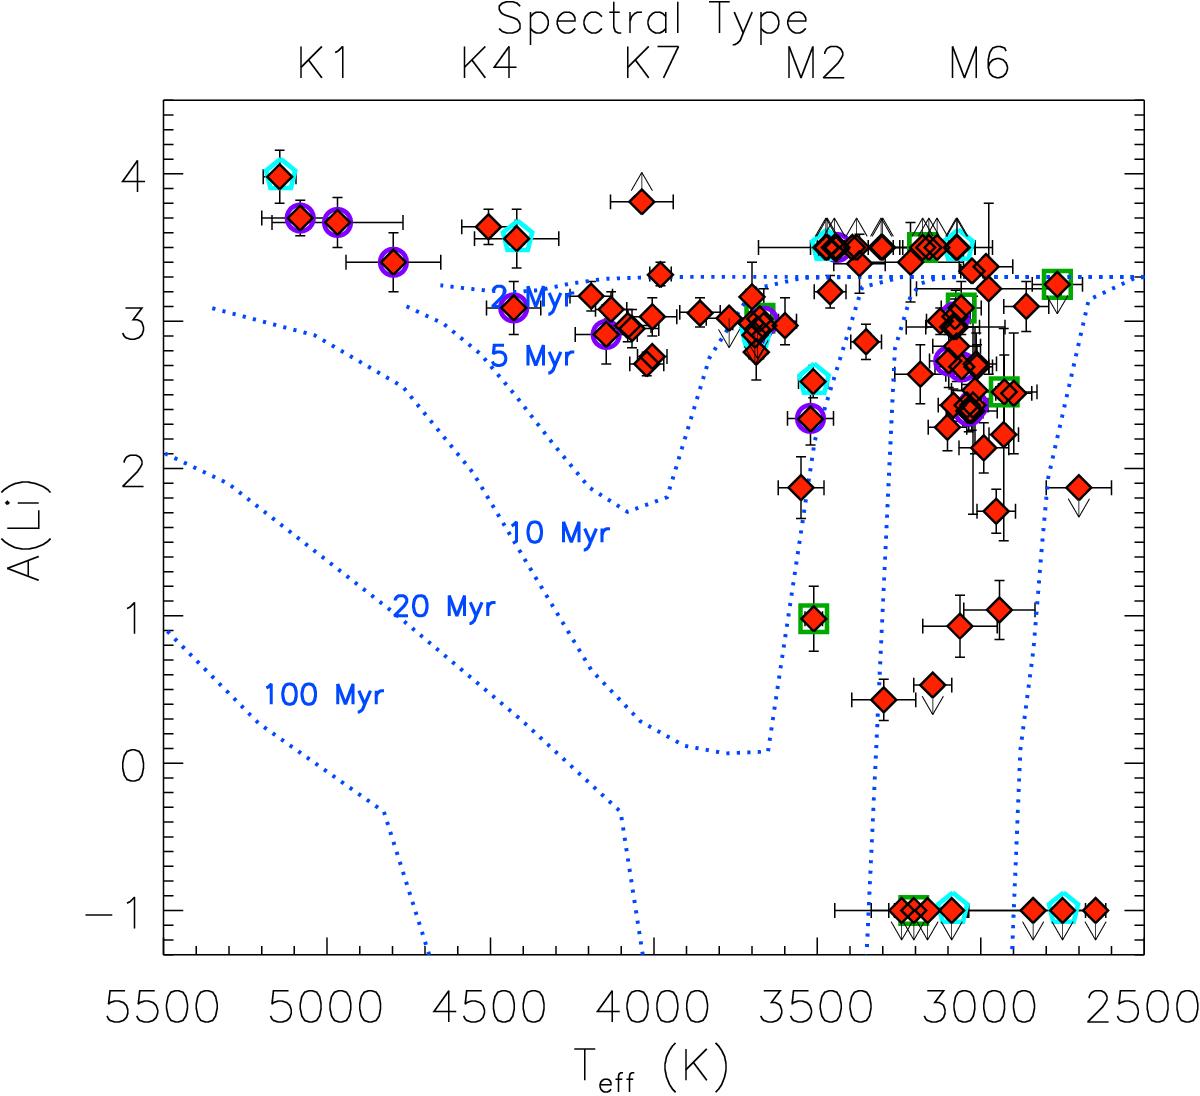
Lithium abundance versus effective temperature. The “lithium isochrones” by Baraffe et al. (2015) in the 2–100 Myr range are overlaid with dotted lines. Arrows refer to upper and lower limits. Open squares, circles, and pentagons represent the position of the class III, transitional disks, and sub-luminous or flat energy distribution targets, respectively. Spectral types as in Fig. 1 are also shown.
Current usage metrics show cumulative count of Article Views (full-text article views including HTML views, PDF and ePub downloads, according to the available data) and Abstracts Views on Vision4Press platform.
Data correspond to usage on the plateform after 2015. The current usage metrics is available 48-96 hours after online publication and is updated daily on week days.
Initial download of the metrics may take a while.