Fig. 4
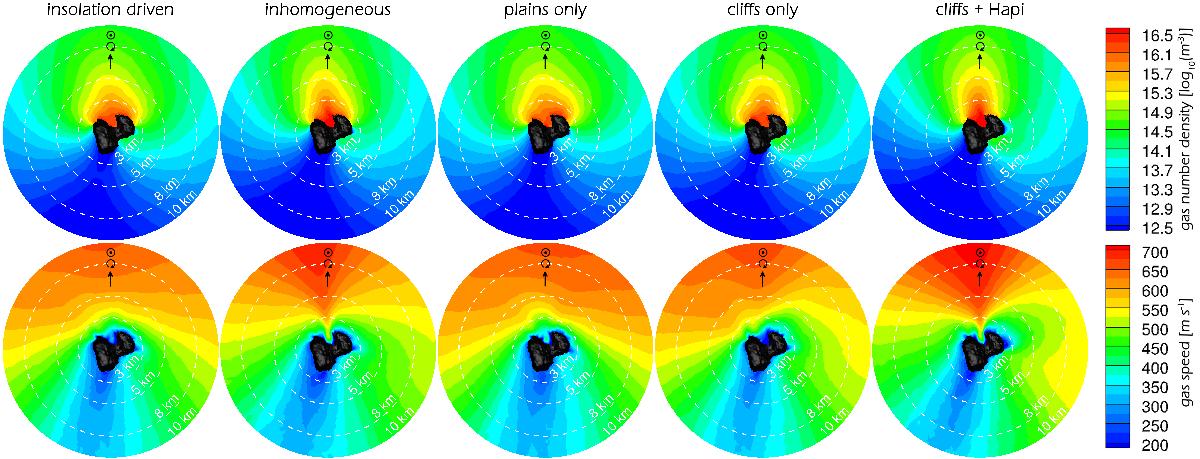
View of a slice through the 3D gas solutions for the sub-solar longitude of 140°. The plane shown is normal to the terminator plane, and has been chosen such that the highest-activity regions can be seen. The views do not reflect the geometry of “image A” in Sect. 4. The direction of the Sun is in the shown plane, the rotation axis of the comet comes out of the plane but has the same projected direction as the Sun direction in this view. The top row shows the gas number density [log10(m-3)] for the five models (columns). The bottom row shows the gas speeds [m s-1] for the five models (columns). The 3D shape of the comet is also displayed.
Current usage metrics show cumulative count of Article Views (full-text article views including HTML views, PDF and ePub downloads, according to the available data) and Abstracts Views on Vision4Press platform.
Data correspond to usage on the plateform after 2015. The current usage metrics is available 48-96 hours after online publication and is updated daily on week days.
Initial download of the metrics may take a while.