Fig. 10
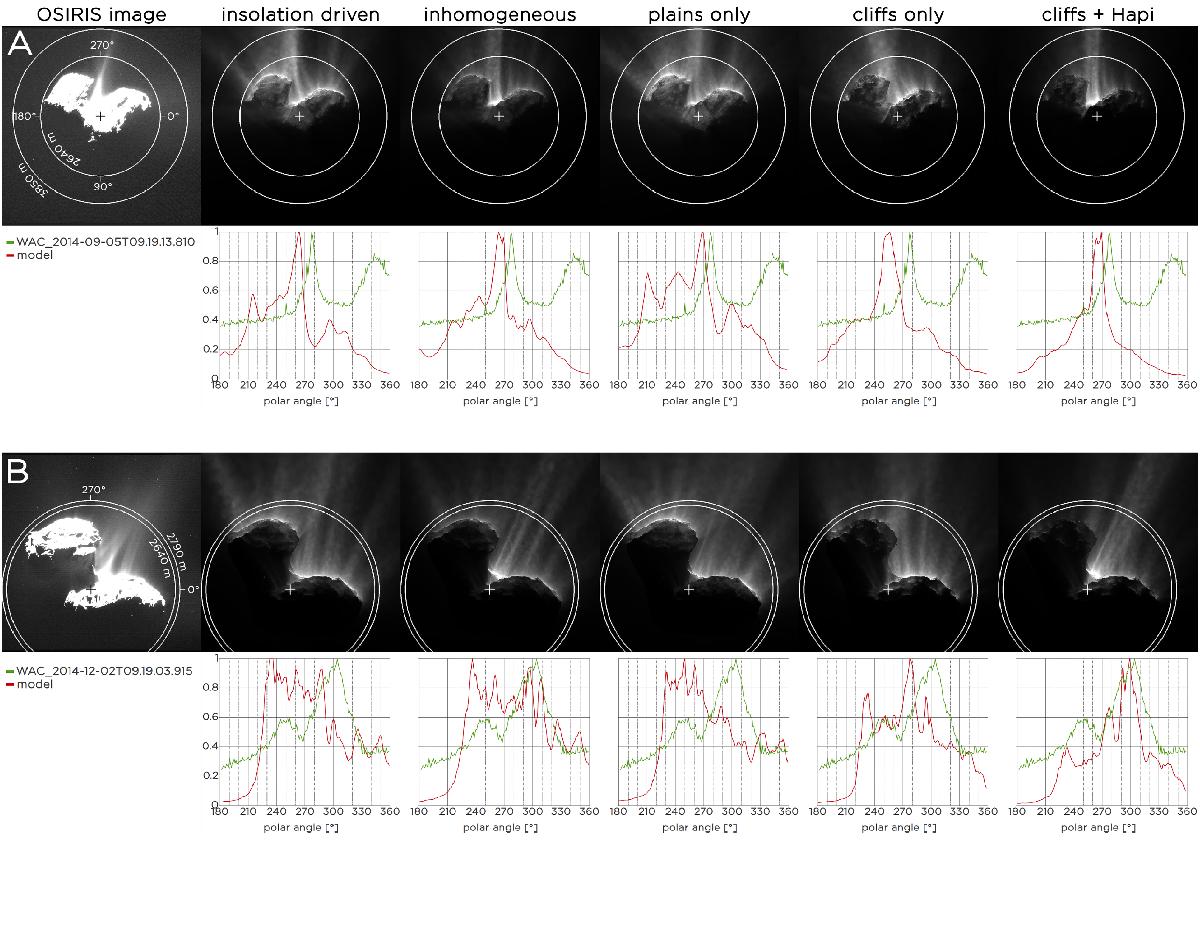
Artificial dust brightness images of our five models compared to the OSIRIS images WAC_2014-09-05T09.19.13.810Z (image A) with a sub-solar longitude of 140° and WAC_2014-12-02T09.19.03.915Z (image B) with a sub-solar longitude of 218°. The second and fourth rows show polar profiles of the relative dust brightness radially integrated from the inner to the outer circles drawn multiplied by the radial distance for the OSIRIS images and the respective model. The profile of image A shows an increase starting at a polar angle of 320° and maximum at 345°. This increase is due to a ghost image as described in Tubiana et al. (2015b). The crosses in the images mark the centre of the nucleus.
Current usage metrics show cumulative count of Article Views (full-text article views including HTML views, PDF and ePub downloads, according to the available data) and Abstracts Views on Vision4Press platform.
Data correspond to usage on the plateform after 2015. The current usage metrics is available 48-96 hours after online publication and is updated daily on week days.
Initial download of the metrics may take a while.