Fig. 10
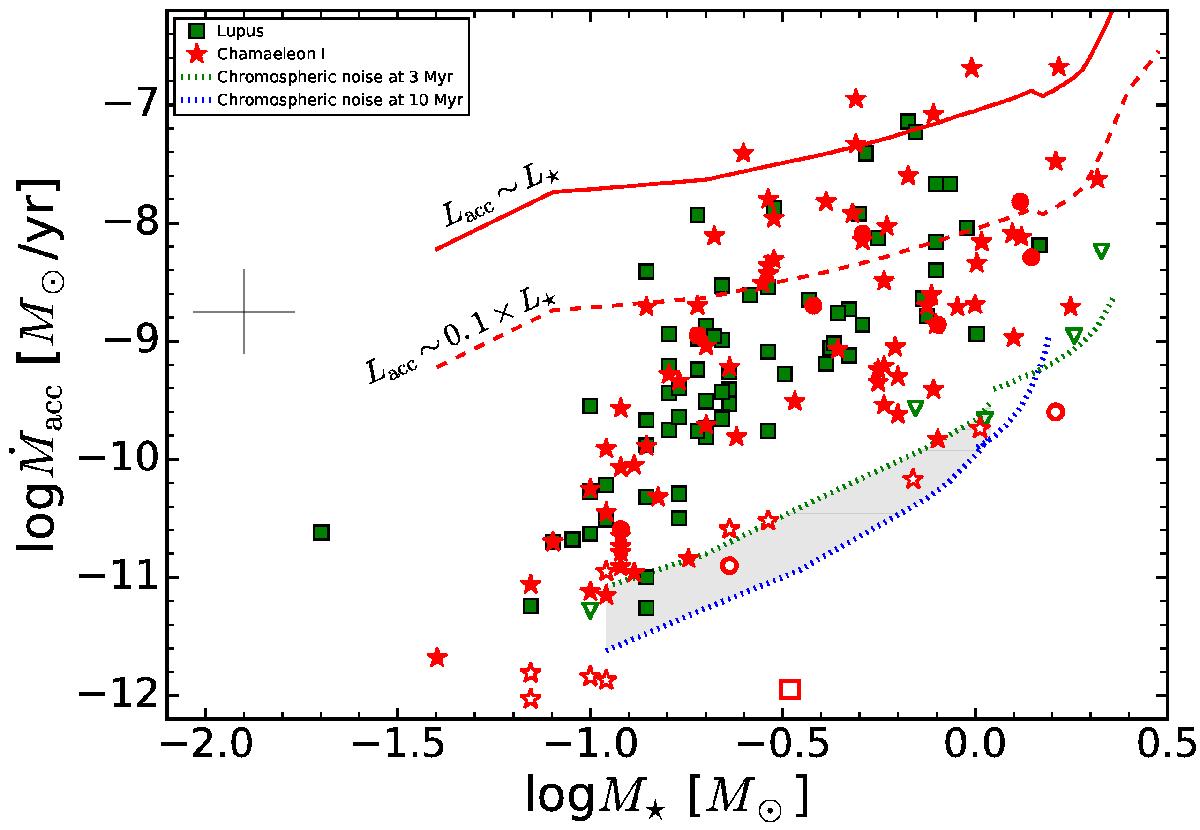
Compilation of mass accretion rates vs. stellar masses measured from VLT/X-shooter spectra by Alcalá et al. (2014, 2017, green squares, Lupus sample) and by Manara et al. (2016, 2017, red stars, Chamaeleon I sample). The red solid and dashed lines show the values of mass accretion rates corresponding to objects whose accretion luminosity is respectively equal to the stellar luminosity or to 10% of it. The limits derived here due to chromospheric emission are shown with green and blue dotted lines for ~3 Myr and ~10 Myr old objects, respectively.
Current usage metrics show cumulative count of Article Views (full-text article views including HTML views, PDF and ePub downloads, according to the available data) and Abstracts Views on Vision4Press platform.
Data correspond to usage on the plateform after 2015. The current usage metrics is available 48-96 hours after online publication and is updated daily on week days.
Initial download of the metrics may take a while.