Fig. 2
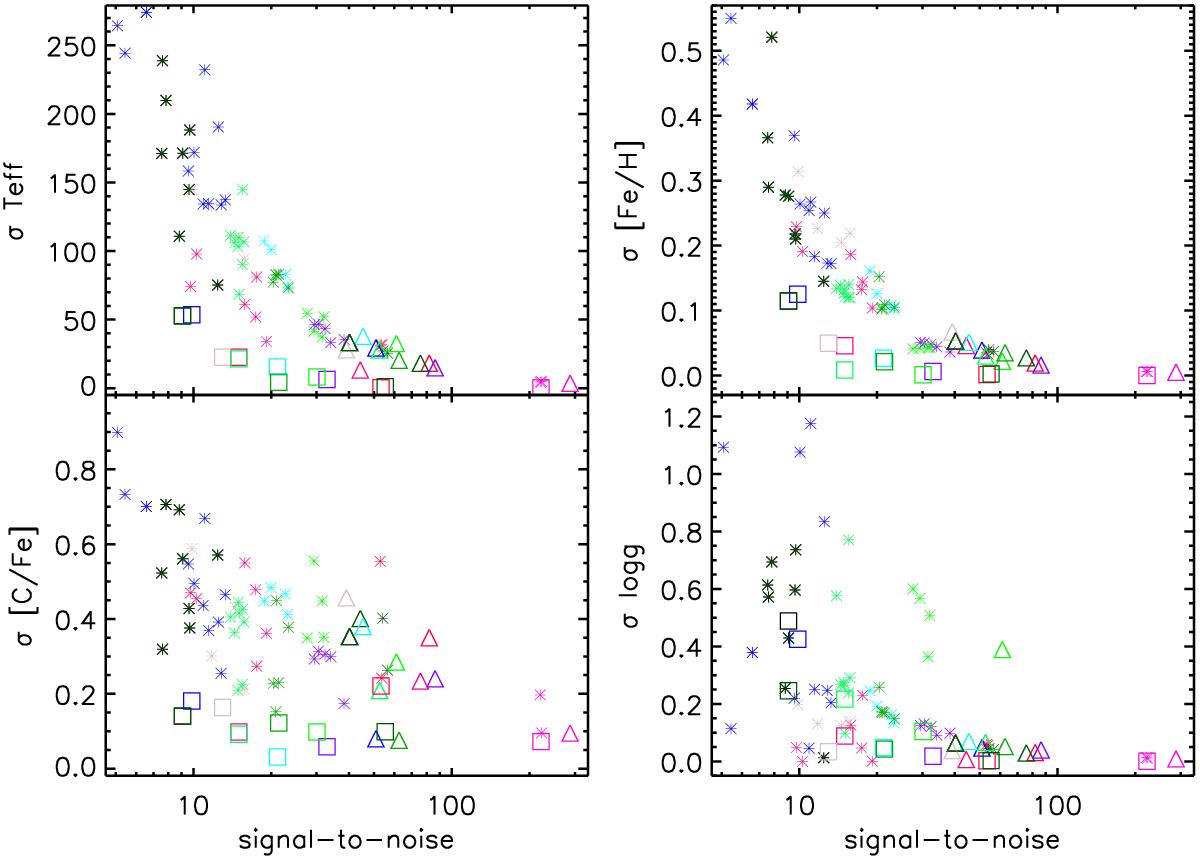
Random errors derived with FERRE as a function of the S/N for individual and combined exposures. Each color represents a different star. The triangles correspond to the combined spectra, and asterisks indicate the individual exposures, with random errors estimated with FERRE and given in Table 2. The squares show the dispersion in the parameters derived from individual exposures, shown at the mean value of their S/N.
Current usage metrics show cumulative count of Article Views (full-text article views including HTML views, PDF and ePub downloads, according to the available data) and Abstracts Views on Vision4Press platform.
Data correspond to usage on the plateform after 2015. The current usage metrics is available 48-96 hours after online publication and is updated daily on week days.
Initial download of the metrics may take a while.