| Issue |
A&A
Volume 605, September 2017
|
|
|---|---|---|
| Article Number | A94 | |
| Number of page(s) | 12 | |
| Section | Planets and planetary systems | |
| DOI | https://doi.org/10.1051/0004-6361/201730617 | |
| Published online | 18 September 2017 | |
Asteroidal and cometary dust flux in the inner solar system
1 INAF-Astronomical Observatory of Padova, Vicolo dell’Osservatorio 5, 35131 Padova, Italy
e-mail: This email address is being protected from spambots. You need JavaScript enabled to view it.
; This email address is being protected from spambots. You need JavaScript enabled to view it.
2 Department of Physics and Astronomy, University of Padova, via Marzolo 8, 35131 Padova, Italy
e-mail: This email address is being protected from spambots. You need JavaScript enabled to view it.
Received: 14 February 2017
Accepted: 24 May 2017
Abstract
Context. Meteoroids impacting terrestrial planets at high speed may have different effects. On bodies without atmospheres, such as the Moon and Mercury, they form impact craters and contribute to the gardening process through which the surface material is constantly mixed. The interaction of high-speed meteoroids with the atmosphere of Venus, the Earth, and Mars, may lead to the deposition in the ionosphere of species such as neutral Mg or Fe and their ionized atoms, caused by ablation processes during the entry.
Aims. In this work we estimate and compare the flux and impact speeds onto the planets of the inner solar system by numerically integrating the orbital evolution of putative dust particles of asteroidal and cometary origin.
Methods. The trajectories of dust particles of different sizes are computed with a numerical code that accounts for the gravitational forces due to all planets, the Poynting-Robertson drag and the solar wind drag. The flux of dust grains on each planet is estimated by calibrating the outcome of our model with the flux on the Earth reported previously.
Results. We obtain new estimates of the flux and impact velocities for both asteroidal and cometary dust particles on Venus and Mars. For Venus we find that cometary grains enter the planet atmosphere at higher speeds, possibly contributing to the upper layers, while asteroidal grains would be relevant for the lower layers, possibly leading to a compositional gradient. This effect is also present for Mars, but it is less marked. We also find that analytical predictions, not taking radiative forces into account, of both flux and average impact speed are reliable for Mars but fail for Venus because of the complex dynamical evolution of grains in the inner solar system.
Conclusions. Our results on the velocity distributions and fluxes of micrometeoroids on the terrestrial planets can be used to put stringent contraints on models that estimate either the superficial material mixing that is due to meteoroid impacts or the formation of ionospheric layers for planets with an atmosphere.
Key words: methods: numerical / methods: statistical / meteorites, meteors, meteoroids / planets and satellites: terrestrial planets
© ESO, 2017
1. Introduction
The main sources of the dust population in the inner solar system are asteroid collisions and debris that is released from short-period comets. The dust grains produced in the asteroid belt slowly evolve under solar radiation and gravitational forces of the Sun and the planets. In particular, particles smaller than 1 cm are significantly perturbed by the Poynting-Robertson and solar wind drag and spiral towards the Sun on timescales that depend on their size and composition.
All the planets and satellites in the solar system encounter interplanetary dust as they move along their orbit. When dust particles enter a planetary atmosphere at orbital speeds, they decelerate and undergo ablation. Meteoroids penetrating the atmosphere are accelerated by the planetary gravitational field and are slowed down by collisions with atmospheric elements. The interaction with the planetary atmosphere removes part of the mass and heats the particle surface, producing an additional loss of mass by evaporation. The interaction of high-speed meteoroids and atmospheric gases, such as Fe and Mg, can lead to the deposition in the planetary atmosphere of species that would otherwise be absent. In this way, meteoritic influx modifies the vertical profiles of the plasma density in a planetary ionosphere (Molina-Cuberos et al. 2008; Withers et al. 2008).
When they enter the Earth’s atmosphere, most of the micrometer-sized particles are melted during atmospheric deceleration. Because the surface gravity is lower and the atmosphere is thinner on Mars than on the Earth, Mars is a favorable planet for the study of unaltered material of micrometeoritic dust grains after the atmospheric entry.
Adolfsson et al. (1996) provided an estimate of the sizes of meteoroids that most likely remain unmelted during the atmospheric entry at Mars. For low-speed meteoroids, a significant fraction of meteoroids in the diameter range between 60−120 μm survives the Mars atmospheric entry unmelted. For high-speed meteoroids, the size range of unmelted material is shifted to 2−40 μm (Adolfsson et al. 1996; Flynn & Mckay 1989, 1990). Particles with a dimension of up to 100 μm can essentially survive the atmospheric entry unaltered after interacting with the stratosphere and moving down into the surface (Brownlee 1985).
Mercury and the Moon have an extended and tenuous exosphere that is made up of atoms that are released from the surface by energetic processes. These processes can include micrometeoritic impacts, photon-stimulated desorption by UV radiation, ion sputtering, and thermal vaporization. Since the exobase is at the surface, the sources and sinks of the exosphere are tightly linked to the composition and structure of the planet or satellite surface. In this way, the regolith layer on the Moon and Mercury is continuously reworked by meteoritic impacts. Repetitive impacts shake the surface by means of fragmentation and emersion of new material, hence, there is a continuous turnover that supplies the surface with fresh material (Killen et al. 2007; Morgan et al. 1988).
Because we expect that most of the particles arrive unmelted at the surface and that they interact with the atmosphere during their entry, it is important to study the interaction between the micrometeoritic dust particles and the soil of planets or satellites that are entirely without atmosphere or have a weak atmosphere. In order to do this, we have to consider three important factors (here the focus is only on the first two of them): meteoritic flux, velocity distribution of dust grains, and the chemical composition of the soil.
The orbital evolution of dust meteorites that interact with the atmosphere and surfaces is especially perturbed by gravitational interactions with the planets. On the other hand, small-particle evolution is dominated by solar radiation pressure forces that cause significant orbital perturbations on timescales that are comparable to or shorter than the gravitational perturbation timescale (Burns et al. 1979; Dohnanyi 1969; Murray & Dermott 1999). For particles in the micrometer-sized range, the dominant radiative effect is the Poynting-Robertson drag, which tends to circularize the orbit of micrometeorites as a function of the size and mass of the dust grain.
In this paper, we study the long-term evolution of dust grains (i.e., r< 100 μm) from main-belt asteroids (MBA) and Jupiter-family comets (JFC) to planets in the inner solar system and the Moon using a dynamical evolution model that follows the orbital path of particles under the effects of the gravitational and non-gravitational forces. By means of numerical simulations, we estimate the flux of dust particles and their impact velocity distribution. The overall flux is tuned on the basis of the results obtained by Cremonese et al. (2012). The authors interpret the data from the Long Duration Exposure Facility (LDEF) experiment (Love & Brownlee 1993) by using an updated and specific scaling law derived from the iSALE shock physics code for the impact craters detected on the facility. Previous studies (Borin et al. 2009; Cremonese 2012) focused on the flux and impact velocities on Mercury and Earth, while here we complete the inventory by also including Venus and Mars in the study. Finally, we compare fluxes and impact velocities on all planets and the Moon and outline dynamical mechanisms that might be responsible for the different impact rate on these bodies.
2. Dynamical evolution model
To estimate the meteoritic flux at the heliocentric distance of different planets, we used the dynamical evolution model of dust particles of Marzari & Vanzani (Marzari & Vanzani 1994). It numerically integrates an (N + 1) + M body problem (Sun + N planets + M bodies with negligible mass) with the high-precision integrator RA15 version of the RADAU integrator by Everarth (Everhart 1974). The initial orbital elements of all planets are taken from the JPL Horizon site. Radiation, solar wind pressure, and Poynting-Robertson (PR) drag are included as perturbative forces together with the gravitational attractions of all the planets in the solar system.
The gravitational term is given by 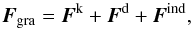 (1)where Fk is the Keplerian force, Fd is the direct force, whose term due to the interaction between planets and dust particles, and Find is the indirect force that represents the interaction force of the central body and dust particles. Equation (1) can be written as
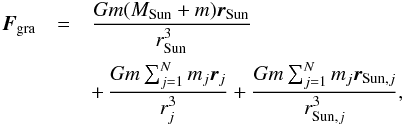 (2)where rSun is the distance between the Sun and dust particles, rj is the distance between planets and dust particles, m is the mass of each dust particle, and N is the number of planets.
The non-gravitational term is made up of two terms: the radiation force, Frad, and the force given by the solar wind, Fwnd,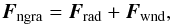 (3)where
  (4)and
 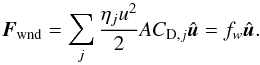 (5)In the previous equations,
  , where c is the velocity of the light (anti-solar direction) and v is the orbital velocity of the dust particle;
  with u = w−v, where w is the solar wind flow bulk velocity in the average phase (Marzari & Vanzani 1994; Mukai & Yamamoto 1982). ηj = njmj is the spatial mass density of the component j of the solar wind flow, with a mass mj and number density nj; A is the geometrical cross-section of the grain; Qpr is the dimensionless radiation-pressure coefficient averaged over the solar spectrum, and CD,j is the dimensionless drag coefficient that is due to the j-component of the wind flow. S is the solar radiation flux density at heliocentric distance r, and we can write
  ; w0 ≃ 4 × 107 cm/s for w at 1 AU and ηp,0 + ηα,0 ≃ 1.2ηp,0 (Marzari & Vanzani 1994).
The efficiency of the radiation and corpuscolar resistive forces can be expressed by defining their ratio to the solar gravity as![Mathematical equation: \begin{equation} \label{beta_r} \beta_{r}=\frac{f_{r}}{f_{g}}\left[\frac{c}{c-\dot{r}}\right]=\left(\frac{S\emph{A}Q_{\rm pr}}{c}\right)\cdot\left(\frac{GM_{\odot}m}{r^{2}}\right)^{-1}, \end{equation}](/articles/aa/full_html/2017/09/aa30617-17/aa30617-17-eq40.png) (6)and
(6)and ![Mathematical equation: \begin{equation} \label{beta_w} \beta_{w}=\frac{f_{w}}{f_{g}}\left[\frac{w}{|\vec{w}-\vec{v}|}\right]=\left(\frac{f_{w0}\psi}{\kappa}\right)\cdot\left(\frac{GM_{\odot}m}{r^{2}}\right)^{-1}, \end{equation}](/articles/aa/full_html/2017/09/aa30617-17/aa30617-17-eq41.png) (7)with
(7)with  and
and  , where fw0 is obtained from fw in the limit of neglecting the velocity dispersion of wind particles and without the contribution of momentum carried away by the sputtered molecules to Fwnd.
Assuming the reference distance r0 equal to 1 AU and the dust particle with a spherical shape of radius s, we obtain 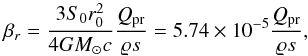 (8)and
 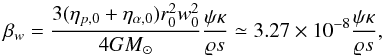 (9)where ϱ is the mass density of the dust particle. Both s and ϱ are in cgs units.
Finally, the relative importance of the radiation and corpuscolar forces can be estimated by the parameter 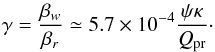 (10)In terms of the parameters βr and γ, the sum of the radiation and solar resistive forces takes the form
 ![Mathematical equation: \begin{eqnarray} \label{nong_force_beta} \vec{F}_{\rm ngra}&=&\beta_{r}f_{g}[(1+\gamma \cos \varphi)\hat{\vec{r}}\mp \gamma(\sin\varphi)\hat{\vartheta}]\nonumber\\ &&-\beta_{r}f_{g}\left[\left(2+\gamma\frac{c}{w}\right)\frac{\dot{r}}{c}\hat{\vec{r}} + \left(1+\gamma \frac{c}{w}\right)\frac{r\dot{\vartheta}}{c}\hat{\vartheta}\right], \end{eqnarray}](/articles/aa/full_html/2017/09/aa30617-17/aa30617-17-eq54.png) (11)where the terms dependent and independent of the dust grain velocity appear separated. Here
(11)where the terms dependent and independent of the dust grain velocity appear separated. Here  is the unit vector normal to
  in the orbital plane (positive in the direction of the grain motion),
 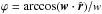 is the angle that the average solar wind flow direction forms with the grain velocity. The first part of Eq. (11) is the sum of the radiation pressure force
  with the corpuscolar pressure force βwfgŵ = fww/u split into its radial and transverse components. The latter part in Eq. (11) is the sum of the classical PR drag with the solar wind drag (Marzari & Vanzani 1994).
3. Initial conditions for asteroidal dust and cometary dust particles
3.1. Asteroidal dust
We considered a ring of 1000 asteroidal dust particles in prograde orbit with radius between 5−100 μm (mass range 1.31 × 10⁻⁹−1.05 × 10⁻⁵ g). We adopted an initial distribution of the orbital elements with the characteristics used by Borin et al. (2009). The initial semimajor axis was randomly selected to lie between 2.1 and 3.3 AU, the initial eccentricity varied in the range 0.0−0.4, and the inclination varied in the range 0−20°. This choice reflects the typical orbital elements of the asteroid belt (Sykes & Greenberg 1986; Gradie et al. 1989; Zappala’ & Cellino 1993; Zappala’ et al. 1994; Milani & Knezevic 1994; Sykes et al. 2004). We assumed a grain density of 2.5 g cm-3, which is a reasonable value for dust particles coming from the MBA (Grün et al. 1985). Spherical particles are considered in the approximation of Mie’s theory, for which Qpr, the dimensionless radiation-pressure coefficient averaged over the solar spectrum, is 0.53 (Marzari & Vanzani 1994; Mukai & Yamamoto 1982).
3.2. Cometary dust
For the JFC dust particles we considered orbits with an initial semimajor axis in a range between 2.5 and 26.7 AU with the majority of dust grains in the range between 2.5 and 8 AU, eccentricity in a range interval between 0.3 and 0.9, orbit inclination in the range 0−81° with a high concentration of particles in the range between 0−45°. In this case we assume a density of  , and radiation pressure coefficient Qpr = 0.53 as in the asteroid grain simulations (Marzari & Vanzani 1994; Mukai & Yamamoto 1982). The initial orbital elements of comets are taken from Nesvorny et al. (2010) and Levison & Duncan (1997), who followed the evolution of bodies originating in the Kuiper Belt as they are scattered by planets and evolve into the inner solar system. In their input list of source objects, Nesvorny et al. (2010) considered a JFC to become active at the time when the perihelion distance, q, first drops below 2.5 AU in the Levison & Duncan (1997) simulations. The orbital distribution of visible JFCs obtained with this model by Levison & Duncan (1997) well approximates the observed distribution. While for asteroidal dust particles the initial mean anomaly is randomly sampled between 0° and 360°, the JFC grains are started at the perihelion when the mean anomaly M = 0. This second sampling procedure for the mean anomaly is dictated by the relation between dust emission and cometary activity. Dust emission starts with comet outgassing, which has its peak at the perihelion where the comet is closer to the Sun. It is then reasonable to assume that dust reaching the inner planets was mostly produced during the perihelion passage (Borin et al. 2016b). Figure 1 shows the initial distribution of cometary dust grains used in simulations.
For JFC we take into account particles with radius of 10, 50, and 100 μm.
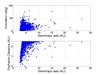 |
Fig. 1 Initial orbital distribution of JFCs. Figures show the inclination and the perihelion distance as function of the semimajor axis. |
4. Flux estimate
We computed the orbital evolution of the dust grains until all the particles have completely moved inside the orbit of the considered planet. To estimate the flux of impacting grains, we used a statistical approach. Each time a dust grain fell within ten times the sphere of influence of the planet, we recorded the minimum approach distance and the grain-planet relative velocity. At the end of the run, we had a list of close encounters that was statistically analyzed.
We distributed the encounters in bins of radial distance from the planet center and performed a least-squares fit to the data with a parabola function as P0R2. The least-squares fit, performed assuming a standard deviation for each data bin of  (where Ni is the cumulative number of close encounters in each bin), allows us to compute the parameter P0 (Marzari et al. 1996). When R is the radius of the planet, we obtain the fractional number of impacts on the surface of the planet nM. We took the gravitational focusing factor that is due to planet attraction into account. The relative velocity distribution is instead well approximated by the distribution computed for each close encounter, properly corrected for the gravitational focusing factor.
The numerical simulations provide the orbital evolution of dust grains and their non-calibrated flux at Earth and the considered planet. By comparing the numerical results at Earth with data given by the literature and calibrating our numerical flux with the flux estimated by Cremonese et al. (2012), we can extrapolate the flux on the considered planet. To calibrate our flux, we need to know the density of the particles within our initial ring, which we obtained by means of the observed flux of grains on Earth. This was obtained by recording the close encounters of test particles with Earth during each simulation. We then extrapolated the flux gE(r) of particles of a given size r on the surface of Earth. We then derived a set of calibration coefficients C(r) for all the sizes we considered in our simulations given by C(r) = gi(r) /gE(r), where gi represents the flux computed for each planet that was taken into account. These coefficients represent the change in the flux of equal-sized particles when they move from Earth to the considered planet (Borin et al. 2009). We calibrated our results using the flux curves obtained by Cremonese et al. (2012). These authors revised the dust particle flux impacting Earth by simulating the impact craters measured on the Long Duration Exposure Facility satellite with the shock physics code iSALE. The coefficients we computed are used to convert the curve of the terrestrial meteoroid flux given by Cremonese et al. (2012) into that on the target planet.
5. Results: asteroidal dust
In this section we briefly revise our previous results concerning asteroidal dust that impacts the Earth-Moon system and Mercury and compare them with the new results for Mars and Venus. We can thus outline the differences in the flux intensity and impact speed on all terrestrial planets because of the different dynamical behavior of dust particles in their evolution toward the Sun. We also test analytical predictions with our numerical results for Mars and Venus, showing that there are significant differences. The reason for this is mainly that the analytical formulas do not take the complex dynamical behavior of dust particles into account.
5.1. Mercury and the Earth-Moon system
We briefly summarize here the results previously obtained for the Earth-Moon system and Mercury. We also recapitulate the method adopted to properly tune the flux from the observed impact statistics on Earth.
Cremonese (2012) considered the accurate measurements of the dimensions of all the hypervelocity impact craters collected on the space-facing end of the gravity-gradient-stabilized LDEF satellite (Love & Brownlee 1993) in order to determine the mass flux of extraterrestrial micrometeoroids at Earth in the submillimeter radius range of 5−250 μm. The first step for translating the crater data on LDEF into a flux estimate is to interpret the crater diameters in terms of projectile size. Love & Brownlee (1993) have calculated the meteoroid mass distribution using a polynomial fit to the crater size-frequency distribution along with the mean depth-diameter ratio. The authors adopted a semiempirical scaling law derived from laboratory experiments that were performed in a range of velocities that were significantly different with respect to the impact speeds of the impacting meteroids. To improve the analysis of LDEF data, we specifically explored the relation between crater diameter and projectile size with the hydrocode iSALE. Cremonese (2012) computed a relation between crater diameter and projectile size with the hydrocode iSALE. The ratio between the depth and diameter of the craters is 0.527, accurately measured by Love & Brownlee (1993) on LDEF, and it has been considered as an important constraint for the iSALE simulations (Cremonese 2012).
The resulting average ratio derived by iSALE simulations between depth and diameter is 0.582 for asteroids. This value depends on the precision of the hydrocode simulations, which according to code validation against laboratory experiments (Pierazzo et al. 2008), is 3−4% in radius and 12% in depth.
The range of impact velocities used in the hydrocode simulations have been derived with the dynamical model of dust particle orbital evolution described in Borin et al. (2009).
The results that Cremonese (2012) obtained with iSALE simulations provide a new scaling law that is significantly different from the law used by Love & Brownlee (1993), suggesting that they systematically overestimated the projectile size for any given crater diameter. As a consequence, the peak value of the flux estimated with the scaling law adopted in Love & Brownlee (1993) is more than three times higher than the value we estimated (Cremonese 2012).
To extrapolate the terrestrial flux to the Moon, Cremonese et al. 2013 have taken the different gravitational focusing factors into account, considering that the micrometeoroid flux on the Moon can be computed from that on Earth as (Vanzani et al. 1997) 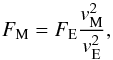 (12)where FM is the flux at the Moon, FE is the flux at Earth, vM = 15.04 km s-1 and vE = 18.6 km s-1 are the average impact velocities on the Moon and on Earth, respectively, derived from the dynamical model (Borin et al. 2009), neglecting atmospheric deceleration. Using the velocity values previously reported, we obtain a flux on the Moon that is 0.65 times that given on Earth (Cremonese et al. 2013).
Figure 2 shows the flux curve at Earth and at the Moon for dust grains in the size range between 5−250 μm derived from Cremonese (2012).
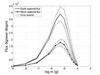 |
Fig. 2 Micrometeoritic flux on Earth and on the Moon in the radius range between 5−250 μm of impacting particles. |
For Mercury we compared our results with the analytical estimates obtained by Cintala (1992), who computed the differential flux as 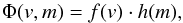 (13)where f(v) is the velocity distribution of dust particles (s/km) and h(m) is the mass distribution function of the impacting particles (g-1 cm-2 s-1).
The velocity distribution function is given by the following formula: ![Mathematical equation: \begin{equation} \label{fv_cintala_densitycost} f(v)=kr^{0.2}\left[\frac{v}{\sqrt{r(v^{2}-v_{\rm Me}^{2})+v_{\rm Ee}^{2}}}\right]^{3} {\rm e}^{\left(-\xi\sqrt{r(v^{2}-v_{\rm Me}^{2})+v_{\rm Ee}^{2}}\right)}, \end{equation}](/articles/aa/full_html/2017/09/aa30617-17/aa30617-17-eq93.png) (14)where k = 3.81, ξ = 0.247 are constant, r = 0.387 AU is the mean distance of Mercury from the Sun, v is the impact velocity of dust particles on Mercury, vEe = 11.1 km s-1 is the escape velocity for the Earth at 100 km altitude, and vMe = 4.25 km s-1 is the escape velocity at the surface of Mercury.
(14)where k = 3.81, ξ = 0.247 are constant, r = 0.387 AU is the mean distance of Mercury from the Sun, v is the impact velocity of dust particles on Mercury, vEe = 11.1 km s-1 is the escape velocity for the Earth at 100 km altitude, and vMe = 4.25 km s-1 is the escape velocity at the surface of Mercury.
The Cintala mass distribution is ![Mathematical equation: \begin{equation} \label{hm_cintala} h(m)=-\frac{1}{mF_{1}}\exp\left(\sum_{i=0}^{11}c_{i}\ln(m)^{i}\right)\cdot \left[\sum_{i=1}^{11}i\cdot c_{i}\ln(m)^{i-1}\right], \end{equation}](/articles/aa/full_html/2017/09/aa30617-17/aa30617-17-eq100.png) (15)where m is the projectile mass, F1 = 0.364, ci are constants (Cintala 1992; Cremonese et al. 2005). We use these formulas below to analytically predict the flux on the other terrestrial planets.
(15)where m is the projectile mass, F1 = 0.364, ci are constants (Cintala 1992; Cremonese et al. 2005). We use these formulas below to analytically predict the flux on the other terrestrial planets.
Compared to the analytical approach used by Cintala (1992), the main advantage of the numerical modeling is that we can properly account for the complex dynamics of dust particles that are strongly perturbed by close encounters with the planets and resonant evolution. We do not make any assumption about the density or velocity distribution since they are directly computed from the particle dynamics. After the calibration at the Earth orbit, we follow the evolution of the particle ring down to the Mercury orbit. The particle density and velocity distributions are both properly derived for each planet directly from the numerical data after they are statistically interpreted.
In our previous papers we found that in the size range between 5−100 μm the mean flux at Mercury is a factor ~58 higher than the flux given in Cintala (1992) (Borin et al. 2016a). The flux as a function of the dust size from our numerical modeling is shown in Fig. 3 and is reported here as an additional reference case for Venus and Mars. In Fig. 4 we summarize the impact velocity distributions on all three planets, Earth, Moon, and Mercury. The mean velocity values vEarth = 18.6 km s-1 for Earth and vMoon = 15.04 km s-1 for the Moon are in reasonable agreement with the literature (Grün et al. 1985; Love & Brownlee 1993; Wiegert 2009), while vMercury = 16.81 km s-1 for Mercury is about 18.0% lower than the value predicted by the model of Cintala (20.50 km s-1). Cintala (1992) computed the mean velocity at Moon and Mercury starting from the velocity distribution function determined by Zook (1975) and Morgan et al. (1988). Cintala (1992) obtained a mean velocity value at the Moon of 12.75 km s-1, which is lower than our estimate and others given in literature. The main difference in the velocity computation is in the method adopted in the present work. The velocity is a direct output of the model that entirely takes the evolution of dust particles into account (gravitational and non-gravitational forces and resonance trapping). A direct consequence of this difference can be found in the computation of the vapor and neutral atom production rates on Mercury since there is a strict relation between the volume of the vaporized target material and the impactor velocity (Borin et al. 2010).
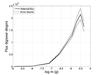 |
Fig. 3 Micrometeoritic flux on Mercury for impacting particles in the radius range between 5−100 μm. |
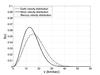 |
Fig. 4 Velocity distribution function of particles impacting Earth, Moon, and Mercury. |
5.2. Venus
We present the new result derived from our model applied to Venus. Venus is a planet with a dense atmosphere consisting of more than 96% C02, and it is shrouded by an opaque layer of highly reflective clouds of sulfuric acid, which prevents its surface from being seen from space in visible light. Estimates of the dust flux on Venus may be used to derive new information on the atmosphere structure of the planet and its evolution.
From the literature it is known that particles of up to 100 μm can survive atmospheric entry almost intact by converting their kinetic energy into heat until they become free-floating in the stratosphere and slowly reach the surface (Brownlee 1985; Christou et al. 2007).
 |
Fig. 5 Panel a: Micrometeoritic flux on Venus in the radius range between 5−100 μm of impacting particles. Panel b: Velocity distribution function of particles impacting Venus. |
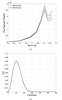 |
Fig. 6 Panel a: Micrometeoritic flux on Mars in the radius range between 5−100 μm of impacting particles. Panel b: Velocity distribution function of particles impacting Mars. |
The ablation of interplanetary dust particles through atmospheric drag and associated heating deposits species such as Mg and Fe into the atmosphere (Grebowsky & Aikin 2002; Murad & Williams 2002). Metallic species are easily ionized, so that meteoroid ablation affects the state of the ionosphere (Withers et al. 2013).
Variations in meteoric layers have been observed at Venus, but have not been convincingly attributed to variations in meteoroid flux (Withers et al. 2008; Pätzold et al. 2009; Pandya & Haider 2012). The lack of observations of meteoroids at Venus and models about variations of the ionospheric behavior in relation to the meteoroid flux means that it is not possible to demonstrate whether variations in meteoroid flux are responsible for some observable alteration in the ionosphere of the planet (Withers et al. 2013). In this context it is important to estimate the micrometeoritic flux at Venus in order to explore its possible relations with the ionospheric changes.
Figure 5 shows the flux curve at Venus for dust grains in the size range between 5−100 μm and the corresponding velocity curve distribution. The estimated total flux is 6.91 × 10⁶ kg/yr, about 25% higher than the flux estimated at Earth, while the average impact velocity is 14.19 km s-1, which is lower than the value at the Earth. Our mean velocity is in the range of values reported in the literature (McAuliffe & Christou 2006; Molina-Cuberos et al. 2008), even though these latter were extrapolated from the velocity at Earth. We give a precise mean value and in particular the distribution that can be used in models of the ionosphere pollution and layer formation. This distribution takes all the dynamical forces into account that influence the evolution of the dust, and it is not a mere extrapolation. In addition, we provide an estimate of the flux that is not given in literature. An alternative easy way to compute the flux is to use the analytical Eqs. (13), (14), and (15). From these, we obtain for the flux 3.90 × 10⁷ kg/yr, which is about six times higher than our estimate. This confirms that the dynamics of dust particles while they evolve toward the Sun under PR-drag significantly influences the flux estimate, and it supports our choice of a full numerical approach.
5.3. Mars
Figure 6 shows the flux curve and the velocity distribution of impacting asteroidal particles on Mars. When we compare Figs. 6 and 2, the results of the dynamical model show that the flux on Mars is about 0.53 times lower than that on Earth, as reported in Table 4.
Mean velocity measured in km s-1 at Earth and Mars obtained by different authors.
On the basis of the known properties of dust population and dynamical arguments, Adolfsson et al. (1996) attempted to predict the flux of meteordoids at Mars from that on Earth by decreasing the number spatial density with heliocentric distance, reducing the gravitational focusing that is due to the lower mass of Mars, and finally accounting for the lower Keplerian speed. They estimated the flux of high-speed meteoroids of asteroidal and cometary origin, with masses in the range 10-8−102 g, to be approximately ~50% of the flux at Earth. This is in good agreement with our results and shows that in the case of Mars an analytical scaling appears to be a good approach. This does not mean that resonances, close encounters, and PR-drag are not relevant in determing the flux, but they are already accounted for when the flux on Earth is computed that is then tuned to observations. The dynamical evolution from Mars to Earth does not produce significant differences in the overall distribution of orbital elements of the dust grains, and this explains why the scaling is a good approximation. This is not the case for Venus, however, because as shown in the previous section, the flux derived through analytical equations is significantly overestimated.
On the other hand, our average impact velocity is 9.1 km s-1, which is lower than the values given in previous papers (Wetherill 1989; Flynn & Mckay 1989, 1990; Davis 1993) and reported in Table 1. However, the impactor sizes found in the previous papers are different from those we considered, and the models of previous teams did not fully take the dynamical evolution of the grains under non-gravitational forces and planetary perturbations into account. The impact speed is an important parameter when modeling the effects of impacts of meteoroids on the surface of a planet, in particular, for estimating the amount of vaporization and neutral atom production rates. The strong dependence of the cratering process on a planet on the impact speed has also recently been suggested by Le Fevre & Wieczorek (2011), who showed that for impactor sizes larger than >1 cm a crater of a given size requires a larger projectile on Mars than on the Moon because of the lower impact velocity on Mars.
It is noteworthy that the impact speed distribution on Mars (Fig. 6b) is less broad at high velocities than that on Moon, Mercury, Venus, and Earth (Figs. 4 and 5b), which confirms that the population of dust grains impacting Mars is less stirred in eccentricity and inclination than the populations impacting the other planets (in particular Venus). High-velocity impacts on Mars are then rarer.
By exploiting Eqs. (13)–(15) of Cintala (1992), it is possible to derive an analytical estimate of the flux on Mars. However, the original Eq. (14) has to be modified to account for the different dependence on the radial distance to the Sun. Since Mars is beyond 1 AU, it is not necessary to apply the distance-density rule (Leinert et al. 1981), and the formula becomes ![Mathematical equation: \begin{equation} \label{fv_cintala_mars} f(v)=kr^{1.5}\left[\frac{v}{\sqrt{r(v^{2}-v_{\rm Me}^{2})+v_{\rm Ee}^{2}}}\right]^{3} {\rm e}^{\left(-\xi\sqrt{r(v^{2}-v_{\rm Me}^{2})+v_{\rm Ee}^{2}}\right)}. \end{equation}](/articles/aa/full_html/2017/09/aa30617-17/aa30617-17-eq121.png) (16)By using these equations, we obtain a value for Mars of 7.50 × 10⁶ kg/yr, which is about three times higher than the value we computed through numerical integration that we reported in Table 4. This again proves that a numerical approach is more reliable in presence of a complex dynamical behavior like that in the inner solar system. In addition, this finding is also opposite to what we obtained with a similar comparison for Mercury, where Eq. (16) gave a much lower flux estimate than was derived from the numerical approach.
(16)By using these equations, we obtain a value for Mars of 7.50 × 10⁶ kg/yr, which is about three times higher than the value we computed through numerical integration that we reported in Table 4. This again proves that a numerical approach is more reliable in presence of a complex dynamical behavior like that in the inner solar system. In addition, this finding is also opposite to what we obtained with a similar comparison for Mercury, where Eq. (16) gave a much lower flux estimate than was derived from the numerical approach.
Impact velocities of particles arriving at the different planets considering a cometary source.
Percentage of particles arriving on Mercury, Venus, Earth, and Mars considering cometary and asteroidal sources.
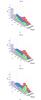 |
Fig. 7 Eccentricity distribution of cometary dust particles at the different planets for dust grains with radii of a) 10 μm; b) 50 μm; and c) 100 μm. |
 |
Fig. 8 Panel a: Eccentricity distribution and b) true anomaly angle (TAA) distribution of asteroidal and cometary dust particles at Venus for particles with a radius of 100 μm. |
6. Results: cometary dust
In the same way as for the asteroidal dust, we computed the dynamical evolution of cometary grains until they crossed the orbit of the target planet. At the end of the run, we know how many particles approached the planet with respect to those that did not have close encounters and flew inside toward the Sun. By comparing the fluxes of particles encountering the planet, we can evaluate the efficiency of cometary dust grains that impact the planet. It is clearly impossible to numerically integrate a number of particles large enough to record actual impacts. As a consequence, this approach is the only feasible way to estimate the relative impact flux on the target planet and compare it to that on Earth. The results of the different numerical simulations are summarized in Tables 2 and 3.
Table 2 shows that the velocities of cometary dust particles at Venus, especially for the larger dimensions tested in this study (50 and 100 μm), assume higher values than for the other planets, even if they are still in the broad velocity range that is generally used in the literature (McAuliffe & Christou 2006; Molina-Cuberos et al. 2008). A possible explanation to understand this behavior can be found in Figs. 7 and 8. The panels in Fig. 7 show that the eccentricity distribution of dust particles that approach Venus has a peak at high eccentricities, which markedly increases for larger sizes. In addition, when compared to the evolution of grains of asteroidal origin, cometary grains have higher eccentricities on average, and they preferentially impact at perihelion, where the velocity difference is higher. Asteroidal grains instead have lower eccentricities, and their impact location is uniformly distributed along the orbit of Venus (see Fig. 8).
The increase in the impact velocity with size observed in Table 2 suggests that even larger meteoroids (larger than 100 μm) will have comparable or even higher speeds when impacting Venus. According to our results, the PR-drag appears to be strong enough to circularize the orbits of cometary grains only for small grains before they impact the planet, and it leads to impact speeds comparable to those of asteroidal grains. This implies that the ablation of icy meteoroids of cometary origin during the atmospheric entry will be faster because of their higher speed than the ablation of rocky meteoroids of asteroidal origin, at least for the larger grains. As a consequence, we would expect a more efficient refilling of the upper layers of the Venus atmosphere by cometary dust, while asteroidal dust would be able to penetrate the planet atmosphere more deeply because of lower velocity of asteroidal dust and because this dust creates layers at lower altitudes. This should lead to a gradient of composition in the layers with altitude over the Venus surface that might be tested by in situ measurements. To estimate this effect reliably, we would also need to know the size distribution of the dust particles depending on their source, but this is not expected to dramatically change this trend.
To test the efficiency of the transport mechanism of dust particles to the different terrestrial planets after they are released from the cometary bodies, we estimated the fraction of grains that impact each planet from the initial sample. We recorded all encounters of dust grains with a planet within ten times its sphere of influence, and we approximated the fraction of impacts on planet i as  . The percentages for each planet are reported in Table 3 for different particle sizes. They help to understand which planet is more effective in capturing dust grains. While for asteroidal grains Mercury has the higher trapping efficiency and therefore the higher impact rate, for cometary bodies this role is taken by Mars. This is due to the different initial orbital elements of the dust particles coming from the two different sources. For asteroidal grains there is a constant flow that increases in density for a smaller radial distance, circularized by PR drag and locally perturbed by mean motion and secular resonances. These effects contribute to give an increasing impact rate for inner planets. On the other hand, cometary dust grains have a wide distribution of orbital elements form their release, and they quickly drift inward because of their high eccentricity values, which are simultaneously circularized by the time they reach the inner regions. This more active dynamics leads to a different impact rate on the planets, in particular, it increases the impact rate on the outer planets through a higher orbital eccentricity, and at the same time, it is also responsible for the marked variability with size of the capture efficiency.
7. Dynamics of dust particles
In this section we brieftly describe the most interesting features of the dynamical behavior of dust particles while they evolve in the terrestrial planet region. We illustrate the most relevant mechanisms with some examples. These mechanisms alter the particle drift toward the Sun and act differently, depending on the dust origin and size. In Fig. 9 we show the typical evolution of asteroidal dust grains. We selected several dust particles for each dimension. Large grains (100 μm) are dominated by resonance trapping in the proximity of Earth, during which the eccentricity is excited to high values. They are also influenced by close encounters, mostly with Earth, but this does not cause large orbital changes. The frequent resonant trapping and corresponding growth in eccentricity prevents the impact velocities of larger grains from decreasing significantly with smaller radial distances. Smaller grains (10 μm) evolve very quickly because they are dominated by the PR-drag, which drives them quickly toward the Sun. They may be captured in resonance, as shown in Fig. 9, but the trapping does not last long, and they quickly resume their inward migration.
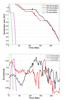 |
Fig. 9 Typical dynamical evolution of asteroidal dust grains. The larger grains (100 μm) evolve on a timescale of a few hundred Myr and show frequent captures in mean-motion resonances with Earth. Smaller particles (10 μm) drift on a shorter timescale of some tens of Myr, mostly influenced by PR-drag. Resonant captures can occur, but they last only a short time. |
Cometary dust grains are mostly dominated by close encounters with the inner planets, as shown in Fig. 10, where four different representative evolution paths are plotted. Large step changes in the orbital elements are observed when gravitational encounters occur, and this behavior persists during the whole evolution of the particle. Owing to the high eccentricity typical of cometary grains, they span a wide range in radial distance with a high probability of approaching all terrestrial planets. The high eccentricity also speeds up the radial migration toward the Sun, which is faster than that of asteroidal grains. Smaller dust grains (10 μm) evolve very quickly on a timescale of a few Myr because of the strong PR-drag.
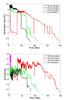 |
Fig. 10 Typical dynamical evolution of cometary dust grains to be compared to that of asteroidal dust grains in Fig. 9. The fast evolution induced by PR-drag through the high eccentricity is frequently interrupted by close encounters with the terrestrial planets. Rare short-term resonant trapping with Jupiter is observed at the beginning of the dynamical evolution of dust particles. Smaller grains evolve toward the Sun on a timescale shorter than 10 Myr. |
These dynamical features affect the impact probability and velocity in different ways that depend on the planet and type of particles, as described in the previous sections.
8. Discussion
In Table 4 we compare the flux of dust particles on each terrestrial planet obtained by numerically integrating asteroidal dust particles. In the second column we report the absolute flux, while in the third column we normalize the flux to that of Earth. As stated before, the increase in impact flux at smaller radial distances is in agreement with the increase in the spatial density distribution proportional to ~r-1.3 with a steeper slope within 0.3 AU (Leinert et al. 1981). For Earth, our value is lower than that given by Grün et al. (1985), which is 14.84 × 10⁶ kg/yr in the range 5−100 μm, and the value of 25 × 106 kg/yr in the revision of Love & Brownlee (1993) given by Mathews et al. (2001). Our results are in better agreement with two more recent estimates given in Ceplecha et al. (1998) and Karner et al. (2003). The former claim in their review that dust grains with masses lower than 10-4 g contribute to the total dust flux with 4.0 × 10⁶ kg/yr on Earth’s surface, which is comparable to our 5.6 × 10⁶ kg/yr. This is about 17% of the total dust flux of interplanetary dust, and the remaining 83% is mostly due to a mass range between 108−1011 g (Ceplecha 1992; Ceplecha et al. 1998). Karner et al. (2003) gave an estimate of the rate of extraterrestrial accretion for particles in the size range 0.45−20 μm by determining the iridium content on dust collected from the Greenland Ice Sheet Project 2 (GISP2) ice core samples. Extending the dimension range and hence considering dust particles larger and smaller than in the previous range (up to about 4 cm in diameter), they estimated the total accretion rate as 2.5 × 10⁶ kg/yr. Using Monte Carlo simulations, the authors also evaluated the upper limit for the total extraterrestrial accretion onto Earth to be approximately 6.25 × 10⁶ kg/yr (Karner et al. 2003), which is close to the flux estimated in our work.
Estimated flux values at different planets and Moon.
Velocity values of asteroidal and cometary dust at different planets and Moon.
We also find that the estimated flux on Mars based on a detailed dynamical modeling is in good correspondence with the predictions of Adolfsson et al. (1996). By far the largest difference is found for Mercury, where our computed flux is significantly higher than the flux derived from analytical formulations by Cintala (1992). We also present the first reliable estimate of the flux on Venus, which may be usefully exploited to derive the effects of meteroid bombardment on the formation of dusty layers on the atmosphere of the planet.
Table 5 shows the mean velocity values of asteroidal and cometary impacting particles. The velocity of dust particles v relative to the planet is computed as  (17)where vce is the velocity of dust grain at the close encounter with the planet and vesc is the escape speed from the surface of the target body.
A substantial difference in the mean velocity values of asteroidal and cometary dust particles can be observed for all planets (see Table 5). This may be ascribed to the initially different distribution and to the different dynamical paths, as discussed in the previous section. In particular, while for small particles the PR drag is dominant, resonant effects and close approaches have a central role for larger particles and introduce effects that cannot be simply scaled out with radial distance. For Mars the dust particles coming from the main belt are not strongly affected by dynamical effects, so that their distribution resembles the original distribution and the impact velocity is low. However, as soon as the particles reach Earth, the impact speed increases because of the different dynamical mechanisms that excite the eccentricity in particular. At Venus the impact speed is lower, possibly because of progressive circularization through PR drag, and finally, at Mercury it is high again because of the fast Keplerian period and the possibility of impacts of particles with high eccentricity at perihelion. The mean impact velocities of cometary particles are instead significantly higher for Mars and Venus, while they are comparable for the other bodies. For Mars, the reason is that the grains did not have enough time to be circularized during their drift so that their inclinations and eccentricities are higher than the dust of asteroidal origin. For Venus, close encounters with Earth lead to a new peak in eccentricity when they encounter the planet, in most cases close to perihelion, even higher than that at Mars, as shown in Figs. 7 and 8. This leads to the high impact speeds in particular for larger grains, which are damped by PR-drag on a longer timescale. The two different dust sources have typical impact speeds that are also different at Earth, but in this case, the reverse occurs: the mean velocity value of asteroidal dust particles is higher than the cometary velocity. This might be an effect of the frequent resonant trapping around the planet during which the eccentricity is slowly pumped up. Resonances rarely occur for cometary grains.
For cometary dust grains we find a mean value that is slightly beyond the range given by Nesvorny et al. (2010) of 11.2−15 km s-1, but this may depend on the way in which we computed the average, the definition of the range in Nesvorny et al. (2010), and on statistical noise.
The flux of interplanetary meteoroids can affect the ionospheric structure of planets like the Earth, as well as Mars and Venus. The ablation of a continuous flux of dust in the atmosphere gives rise to permanent layers of free neutral and ionized metal atoms. Icy meteoroids coming from comets ablate more easily and at higher altitude than stony meteoroids, which are produced in the main belt. Moreover, rocky material introduces a higher amount of metal constituents in the atmosphere than icy meteoroids. The altitude of the ablation depends on the physical characteristics of meteoroids, such as speed, size, composition, and volatility. When the ablation of meteoroids is known, it is possible to compute the concentration of the individual ion species, which depends on the meteoroid velocity because the ionization of atoms of a particular species takes place at a higher velocity than the threshold velocity (Jones 1997; Molina-Cuberos et al. 2008). In the case of Mars, low-speed meteoroids, that is, a large fraction of meteoroids in the radius range between 30−600 μm, will survive the atmospheric entry unmelted (Flynn & Mckay 1989; Adolfsson et al. 1996). On planetary bodies without atmospheres, the exosphere components are modified by different processes. Meteoroids can reach and impact the surface of the Moon and Mercury, affecting the evolution of the regolith blanket. The meteoroid and regolith are both partly vaporized during impact, and the molecules are released into the exosphere, while on the surface a new crater forms. The impacts of smaller particles play an important role in providing volatiles, and the contribution as mechanism source to the exosphere depends on the meteoroid velocity since there is a tight correlation with the vapor rate (Cremonese et al. 2005; Bruno et al. 2007).
9. Conclusions
We have estimated and compared the flux and impact velocities of micrometeoroids in the radius range 5−100 μm onto terrestrial planets and the Moon. These estimates are based on an accurate numerical modeling of the dynamical evolution of the dust grains. We calculated their evolution under gravitational and non-gravitational forces, which leads to a complex interplay between resonances and close encounters. We estimated new flux values and impact velocities on Venus and Mars and compared them to our previous estimates for the Earth, Moon, and Mercury. This comparison is fruitful as it allows us to highlight how the different dynamical mechanisms affect the impact rate on each planet and how radiative forces can significantly affect fluxes.
This work has interesting implications for the computation of atoms that are released in the exosphere of Mercury and Moon (Cintala 1992; Cremonese et al. 2005). The surfaces of Mercury and the Moon are constantly bombarded by dust particles from the interplanetary medium, which mixes the surface regolith and creates a vapor cloud at high energy that is representative of the surface composition. The amount of material produced by impact vaporization depends on both the impactor and surface compositions and the micrometeoroid flux to the surface. The ratio between the volume of melted particles and the volume of vapor depends on the impact velocity as well as other impactor-, surface-, and impact-related parameters. The rate of the impact vaporization at Mercury is still uncertain because of the uncertainties in the composition of the interplanetary dust and the planet soil and the vapor production rate of the impacting dust particles (Burger et al. 2010; Borin et al. 2010). Colaprete et al. (2016) have used NASA’s LADEE orbiter to investigate how the exosphere of the Moon varies over time. The Ultraviolet/Visible Spectrometer (UVS) data suggest a strong link between meteoroid streams and the exosphere. It might therefore be interesting to further investigate relations between meteoroid impacts and interactions with the surface and exosphere of the satellite.
Our new estimate of the micrometeoritic flux on Venus and Mars could have some implications on the understanding of the meteoric layers of these planets. Many authors found that meteoritic layers are sensitive to the meteoroid influx rate (Janches et al. 2006; Withers et al. 2013; Grebowsky et al. 2017). Meteoric layers are only sporadically present in ionospheric observations of Venus and Mars, and they are not explained as yet. This sporadic occurrence could be caused by internal factors such as changes in neutral atmospheric dynamics that affect layer formation, or by external factors such as the meteoroid influx rate (Withers et al. 2013).
Interplanetary dust grains falling on Mars also represent a significant source of contamination of the soil. Because of its small size, Mars has a low surface gravity that leads to lower atmospheric entry velocities than at Earth. As a consequence, dust particles decelerate in the atmosphere of Mars, experience weaker heating, and can often reach the surface intact. This causes the accretion of unmelted meteoritic material onto the planet, which is one of the most commonly accepted sources of organic material on Mars (Atreyaa et al. 2007; Nemtchinov & Shuvalov 2002; Bland & Smith 2000; Flynn 1996; Flynn & Mckay 1990). The subsequent degradation of this organic material is a possible source of the methane that has recently been detected in the Martian atmosphere (Fonti & Marzo 2010; Formisano et al. 2004; Geminale et al. 2008, 2011; Krasnopolsky et al. 2004; Mumma et al. 2009). The knowledge of an accurate value of the flux and impact velocity of dust particles on Mars can help to produce more refined models of organic contamination and subsequent methane production on Mars and test the efficiency of different mechanisms that are able to degrade organic material, such as UV irradiation (Schuerger et al. 2012). This type of soil pollution would also occur at a similar rate on the two satellites of Mars, Phobos and Deimos. The impact of dust grains on the Martian surface may also contribute to the formation and evolution of local dust devils by ejecting and moving dust from the surface, depending on the average entry velocity. The knowledge of the flux and impact velocity distribution can also be used to predict the impact ionization of the surface of Mars and the possible contribution to the formation of significant electric fields on the surface of the planet.
Acknowledgments
This study has been realized under the BepiColombo Agenzia Spaziale Italiana (ASI) contract to the Istituto Nazionale di Astrofisica (INAF) No. I/022/10/0.
References
- Adolfsson, L. G., Gustafson, B. Å. S., Murray, & Carl, D. 1996, Icarus, 119, 144 [NASA ADS] [CrossRef] [Google Scholar]
- Atreyaa, S. K., Mahaffy, P. R., & Wong, A.-S. 2007, Planet. Space Sci., 55, 358 [NASA ADS] [CrossRef] [Google Scholar]
- Bland, P. A., & Smith, T. B. 2000, Icarus, 144, 21 [NASA ADS] [CrossRef] [Google Scholar]
- Borin, P., Cremonese, G., Marzari, F., Bruno, M., & Marchi, S. 2009, A&A, 503, 259 [NASA ADS] [CrossRef] [EDP Sciences] [Google Scholar]
- Borin, P., Bruno, M., Cremonese, G., & Marzari, F. 2010, A&A, 517, A89 [NASA ADS] [CrossRef] [EDP Sciences] [Google Scholar]
- Borin, P., Cremonese, G., Bruno, M., & Marzari, F. 2016a, Icarus, 264, 220 [NASA ADS] [CrossRef] [Google Scholar]
- Borin, P., Cremonese, G., & Marzari, F. 2016b, A&A, 585, A106 [NASA ADS] [CrossRef] [EDP Sciences] [Google Scholar]
- Brownlee, D. E. 1985, Ann. Rev. Earth Planet. Sci., 13, 147 [NASA ADS] [CrossRef] [Google Scholar]
- Bruno, M., Cremonese, G., & Marchi, S. 2007, Planet. Space Sci., 55, 1494 [NASA ADS] [CrossRef] [Google Scholar]
- Burger, M. H., Killen, R. M., Vervack, R. J., et al. 2010, Icarus, 209, 63 [NASA ADS] [CrossRef] [Google Scholar]
- Burns, J. A., Lamy, P. L., & Soter, S. 1979, Icarus, 40, 1 [NASA ADS] [CrossRef] [Google Scholar]
- Ceplecha, Z. 1992, A&A, 263, 361 [NASA ADS] [Google Scholar]
- Ceplecha, Z., Borovička, J., Elford, W. G., et al. 1998, Space Sci. Rev., 84, 327 [NASA ADS] [CrossRef] [Google Scholar]
- Cintala, M. J. 1992, J. Geophys. Res., 97, 947 [NASA ADS] [CrossRef] [Google Scholar]
- Christou, A. A., Oberst, Ju., Koschny, D., et al. 2007, Planet. Space Sci., 55, 2049 [NASA ADS] [CrossRef] [Google Scholar]
- Colaprete, A., Sarantos, M., Wooden, D. H., et al. 2016, Science, 351, 249 [NASA ADS] [CrossRef] [Google Scholar]
- Cremonese, G. 2012, ApJ, 749, L40 [NASA ADS] [CrossRef] [Google Scholar]
- Cremonese, G., Bruno, M., Mangano, V., Marchi, S., & Milillo, A. 2005, Icarus, 177, 122 [NASA ADS] [CrossRef] [Google Scholar]
- Cremonese, G., Borin, P., Lucchetti, A., Marzari, F., & Bruno, M. 2013, A&A, 551, A27 [NASA ADS] [CrossRef] [EDP Sciences] [Google Scholar]
- Davis, P. M. 1993, Icarus, 105, 469 [NASA ADS] [CrossRef] [Google Scholar]
- Dohnanyi, J. S. 1969, J. Geophys. Res., 74, 2531 [NASA ADS] [CrossRef] [Google Scholar]
- Everhart, E. 1974, Celest. Mech., 10, 35 [NASA ADS] [CrossRef] [Google Scholar]
- Flynn, G. J. 1996, Earth, Moon and Planets, 72, 469 [CrossRef] [Google Scholar]
- Flynn, G. J., & Mckay, D. S. 1989, MECA Workshop on Dust on Mars, 3, 23 [Google Scholar]
- Flynn, G. J., & Mckay, D. S. 1990, J. Geophys. Res.: Solid Earth, 95, 14497 [NASA ADS] [CrossRef] [Google Scholar]
- Fonti, S., & Marzo, G. A. 2010, A&A, 512, A51 [NASA ADS] [CrossRef] [EDP Sciences] [Google Scholar]
- Formisano, V., Atreya, S., Encrenaz, T., Ignatiev, N., & Giuranna, M. 2004, Science, 306, 1758 [NASA ADS] [CrossRef] [PubMed] [Google Scholar]
- Geminale, A., Formisano, V., & Giuranna, M. 2008, Planet. Space Sci., 56, 1194 [NASA ADS] [CrossRef] [Google Scholar]
- Geminale, A., Formisano, V., & Sindoni, G. 2011, Planet. Space Sci., 59, 137 [NASA ADS] [CrossRef] [Google Scholar]
- Gradie, J. C., Chapman, C. R., & Tedesco, E. F. 1989, Distribution of Taxonomic Classes and the Compositional Structure of the Asteroid Belt, Asteroids II, Proc. Conference (Tucson: University of Arizona Press), 316 [Google Scholar]
- Grebowsky, J. M., & Aikin, A. C. 2002, In situ measurements of meteoric ions, Meteors in the Earth’s atmosphere (Cambridge University Press) [Google Scholar]
- Grebowsky, J. M., Golani, D., Cardoso, A. C., et al. 2017, Geophys. Res. Lett., 44, 189 [CrossRef] [Google Scholar]
- Grün, E., Zook, H. A., Fechtig, H., & Giese, R. H. 1985, Icarus, 62, 244 [NASA ADS] [CrossRef] [Google Scholar]
- Janches, D., Heinselman, C. J., Chau, J. L., Chandran, A., & Woodman, R. 2006, J. Geophys. Res., 111 [Google Scholar]
- Jones, W. 1997, MNRAS, 288, 995 [NASA ADS] [CrossRef] [Google Scholar]
- Karner, D. B., Levine, J., Muller, R. A., et al. 2003, Geochim. Cosmochim. Acta, 67, 751 [NASA ADS] [CrossRef] [Google Scholar]
- Killen, R. M., Cremonese, G., Lammer, H., et al. 2007, Space Sci. Rev., 132, 433 [NASA ADS] [CrossRef] [Google Scholar]
- Krasnopolsky, V. A., Maillard, J. P., & Owen, T. C. 2004, Icarus, 172, 537 [NASA ADS] [CrossRef] [Google Scholar]
- Le Fevre, M., & Wieczorek, M. A. 2011, Icarus, 214, 1 [NASA ADS] [CrossRef] [Google Scholar]
- Leinert, C., Richter, I., Pitz, E., & Planck, B. 1981, A&A, 103, 177 [NASA ADS] [Google Scholar]
- Love, S. G., & Brownlee, D. E. 1993, Science, 262, 550 [NASA ADS] [CrossRef] [PubMed] [Google Scholar]
- Marzari, F., & Vanzani, V. 1994, A&A, 283, 275 [NASA ADS] [Google Scholar]
- Marzari, F., Scholl, H., & Farinella, P. 1996, Icarus, 119, 192 [NASA ADS] [CrossRef] [Google Scholar]
- Mathews, J. D., Janches, D., Meisel, D. D., & Zhou, Q.-H. 2001, Geophys. Res. Lett., 28, 1929 [NASA ADS] [CrossRef] [Google Scholar]
- McAuliffe, J. P., & Christou, A. A. 2006, Icarus, 180, 8 [NASA ADS] [CrossRef] [Google Scholar]
- Milani, A., & Knezevic, Z. 1994, Icarus, 107, 219 [NASA ADS] [CrossRef] [Google Scholar]
- Molina-Cuberos, J. G., López-Moreno, J. J., & Arnold, F. 2008, Space Sci. Rev., 137, 175 [NASA ADS] [CrossRef] [Google Scholar]
- Morgan, T. H., Zook, H. A., & Potter, A. E. 1988, Icarus, 75, 156 [NASA ADS] [CrossRef] [Google Scholar]
- Mukai, T., & Yamamoto, T. 1982, A&A, 107, 97 [NASA ADS] [Google Scholar]
- Mumma, M. J., Villanueva, G. L., Novak, R. E., et al. 2009, Science, 323, 1041 [NASA ADS] [CrossRef] [PubMed] [Google Scholar]
- Murad, E., & Williams, I. P. 2002, Meteors in the Earth’s Atmosphere (New York: Cambridge University Press) [Google Scholar]
- Murray, C. D., & Dermott, S. F. 1999, Solar System Dynamics (Cambridge University Press) [Google Scholar]
- Nemtchinov, I. V., & Shuvalov, V. V. 2002, J. Geophys. Res., 107, 5134 [CrossRef] [Google Scholar]
- Nesvorny, D., Jenniskens, P., Levison, H. F., et al. 2010, ApJ, 713, 816 [NASA ADS] [CrossRef] [Google Scholar]
- Pandya, B. M., & Haider, S. A. 2012, Planet. Space Sci., 63, 105 [NASA ADS] [CrossRef] [Google Scholar]
- Pätzold, M., Tellmann, S., Häusler, B., et al. 2009, Geophys. Res. Lett., 36, 5203 [NASA ADS] [CrossRef] [Google Scholar]
- Pierazzo, E., Artemieva, N., Asphaug, E., et al. 2008, Meteoritics Planet. Sci., 43, 1917 [NASA ADS] [CrossRef] [Google Scholar]
- Schuerger, A. C., et al. 2012, Methane from UV-irradiated carbonaceous chondrites under simulated Martian conditions, J. Geophys. Res., 117, 8 [CrossRef] [Google Scholar]
- Sykes, M. V., & Greenberg, R. 1986, Icarus, 65, 51 [NASA ADS] [CrossRef] [Google Scholar]
- Sykes, M. V., Grün, E., Reach, W. T., & Jenniskens, P. 2004, Comets II (Tucson: University of Arizona Press), 677 [Google Scholar]
- Vanzani, V., Marzari, F., & Dotto, E. 1997, 28th Annual Lunar and Planetary Science Conf., 481 [Google Scholar]
- Wetherill, G. W. 1989, Meteoritics, 24, 15 [NASA ADS] [CrossRef] [Google Scholar]
- Wiegert, P. 2009, Icarus, 201, 295 [NASA ADS] [CrossRef] [Google Scholar]
- Withers, P., Mendillo, M., Hinson, D. P., & Cahoy, K. 2008, J. Geophys. Res., 113, 12314 [Google Scholar]
- Withers, P., Christou, A. A., & Vaubaillon, J. 2013, Adv. Space Res., 52, 1207 [NASA ADS] [CrossRef] [Google Scholar]
- Zappala’, V., & Cellino, A. 1993, Asteroid families, Asteroids, comets, meteors 1993: proceedings of the 160th International Astronomical Union, held in Belgirate, Italy, June 14–18 [Google Scholar]
- Zappala’, V., Cellino, A., Farinella, P., & Milani, A. 1994, ApJ, 107, 772 [Google Scholar]
- Zook, H. A. 1975, Proc. Lunar Sci. Conf. 6th, 1653 [Google Scholar]
All Tables
Mean velocity measured in km s-1 at Earth and Mars obtained by different authors.
Impact velocities of particles arriving at the different planets considering a cometary source.
Percentage of particles arriving on Mercury, Venus, Earth, and Mars considering cometary and asteroidal sources.
All Figures
|
Fig. 1 Initial orbital distribution of JFCs. Figures show the inclination and the perihelion distance as function of the semimajor axis. |
| In the text | |
|
Fig. 2 Micrometeoritic flux on Earth and on the Moon in the radius range between 5−250 μm of impacting particles. |
| In the text | |
|
Fig. 3 Micrometeoritic flux on Mercury for impacting particles in the radius range between 5−100 μm. |
| In the text | |
|
Fig. 4 Velocity distribution function of particles impacting Earth, Moon, and Mercury. |
| In the text | |
|
Fig. 5 Panel a: Micrometeoritic flux on Venus in the radius range between 5−100 μm of impacting particles. Panel b: Velocity distribution function of particles impacting Venus. |
| In the text | |
|
Fig. 6 Panel a: Micrometeoritic flux on Mars in the radius range between 5−100 μm of impacting particles. Panel b: Velocity distribution function of particles impacting Mars. |
| In the text | |
|
Fig. 7 Eccentricity distribution of cometary dust particles at the different planets for dust grains with radii of a) 10 μm; b) 50 μm; and c) 100 μm. |
| In the text | |
|
Fig. 8 Panel a: Eccentricity distribution and b) true anomaly angle (TAA) distribution of asteroidal and cometary dust particles at Venus for particles with a radius of 100 μm. |
| In the text | |
|
Fig. 9 Typical dynamical evolution of asteroidal dust grains. The larger grains (100 μm) evolve on a timescale of a few hundred Myr and show frequent captures in mean-motion resonances with Earth. Smaller particles (10 μm) drift on a shorter timescale of some tens of Myr, mostly influenced by PR-drag. Resonant captures can occur, but they last only a short time. |
| In the text | |
|
Fig. 10 Typical dynamical evolution of cometary dust grains to be compared to that of asteroidal dust grains in Fig. 9. The fast evolution induced by PR-drag through the high eccentricity is frequently interrupted by close encounters with the terrestrial planets. Rare short-term resonant trapping with Jupiter is observed at the beginning of the dynamical evolution of dust particles. Smaller grains evolve toward the Sun on a timescale shorter than 10 Myr. |
| In the text | |
Current usage metrics show cumulative count of Article Views (full-text article views including HTML views, PDF and ePub downloads, according to the available data) and Abstracts Views on Vision4Press platform.
Data correspond to usage on the plateform after 2015. The current usage metrics is available 48-96 hours after online publication and is updated daily on week days.
Initial download of the metrics may take a while.