Fig. B.1
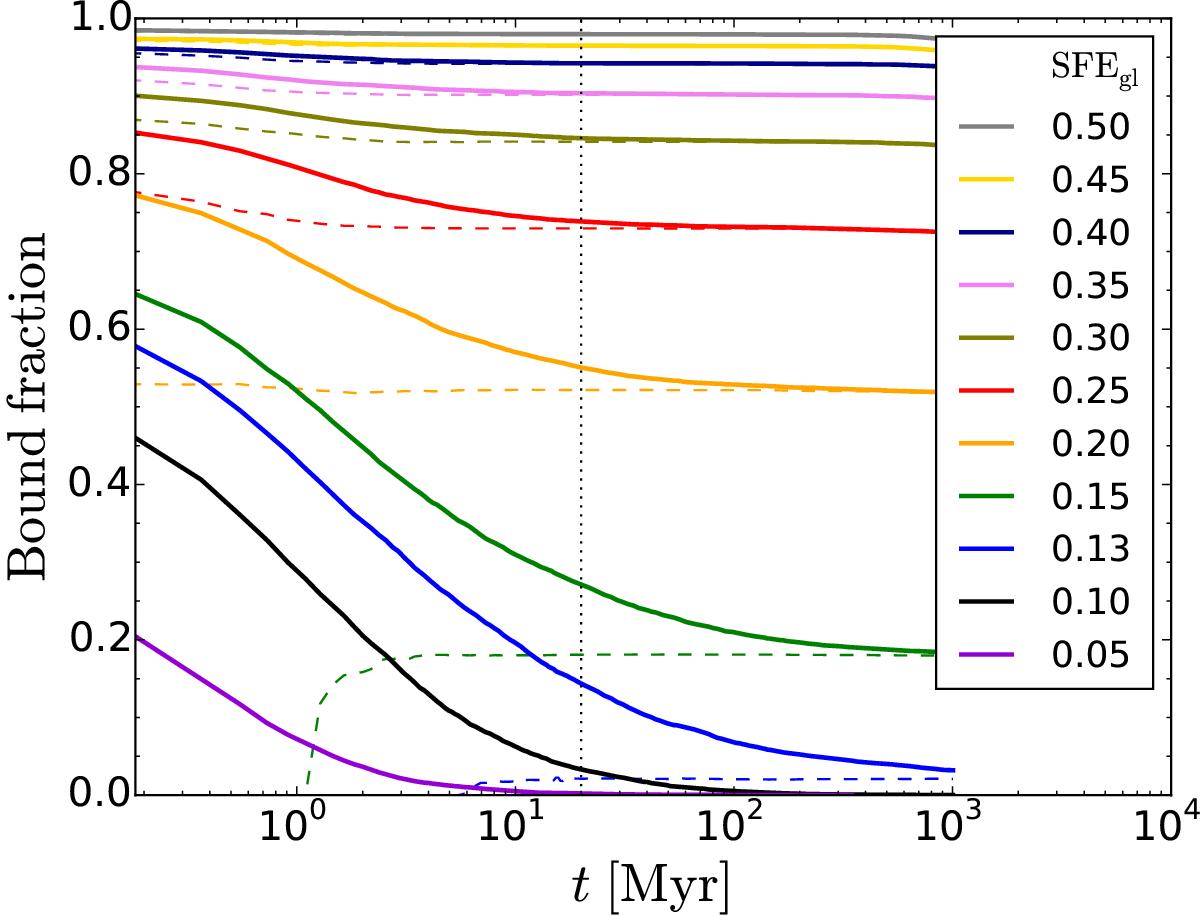
Time evolution of the bound fraction Fb of isolated models (N = 104) as defined by two methods: defined by the fraction of stars with a negative total energy (solid lines), and defined by recalculating the total energy of stars in an iterative process (see text for details; dashed lines). The vertical dotted line corresponds to t = 20 Myr when we scale the isolated models with the same scale factor as for a non-isolated model with M⋆ = 6000 M⊙, which also has N ≈ 104.
Current usage metrics show cumulative count of Article Views (full-text article views including HTML views, PDF and ePub downloads, according to the available data) and Abstracts Views on Vision4Press platform.
Data correspond to usage on the plateform after 2015. The current usage metrics is available 48-96 hours after online publication and is updated daily on week days.
Initial download of the metrics may take a while.